Categories: Technical analysis

CHFJPY Wave Analysis – 11 May, 2020

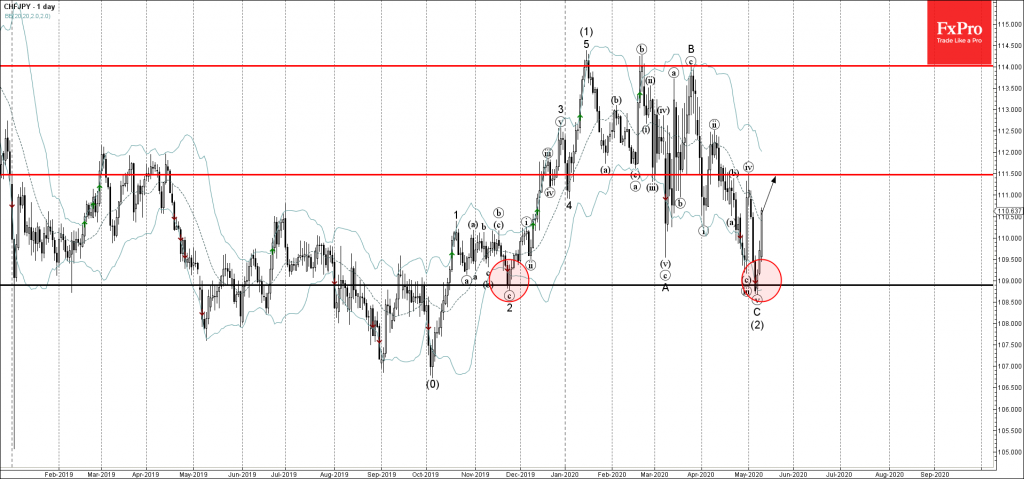
• CHFJPY reversed from key support level 108.80

• Likely to rise to 111.50

CHFJPY recently reversed up from the key support level 108.80 (which stopped the earlier short-term correction 2 in November) – standing near the lower daily Bollinger band.

The upward reversal form the support level 108.80 created the daily reversal pattern Piercing Line – which started the active impulse wave (3).

CHFJPY is expected to rise further toward the next resistance level 111.50 (top of the previous sharp correction (iv)).

AddThis Website Tools
The FxPro Tech Analysis Team

The FxPro technical experts prepare a daily analysis of the most active currency pairs (majors, crosses, exotics) and commodities. Selected instruments are reviewed on daily trends (D1, H4), using the active Elliott Wave setups, Japanese candlesticks, indicators, and support/resistance levels.

Share
Published by
The FxPro Tech Analysis Team
Tags: CHFJPY

Recent Posts

Virgin Galactic Wave Analysis – 26 March 2025

Virgin Galactic: ⬇️ Sell - Virgin Galactic reversed from the resistance area - Likely to…

6 hours ago

GBPUSD Wave Analysis – 26 March 2025

GBPUSD: ⬇️ Sell - GBPUSD reversed from resistance area - Likely to fall to support…

6 hours ago

No need to fear the death cross in BTC

The crypto market experienced a slight increase but remains below the 200-day MA. Bitcoin is…

13 hours ago

WTI crude oil Wave Analysis – 26 March 2025

WTI crude oil: ⬆️ Buy - WTI crude oil broke resistance area - Likely to…

14 hours ago

GBPCAD Wave Analysis – 26 March 2025

GBPCAD: ⬇️ Sell - GBPCAD reversed from resistance zone - Likely to fall to support…

14 hours ago

UK Inflation Cools Down Pound

UK CPI was weaker than expected, with the annual rate slowing to 2.8%. This may…

16 hours ago