Categories: Technical analysis

Chevron Wave Analysis – 16 June, 2020

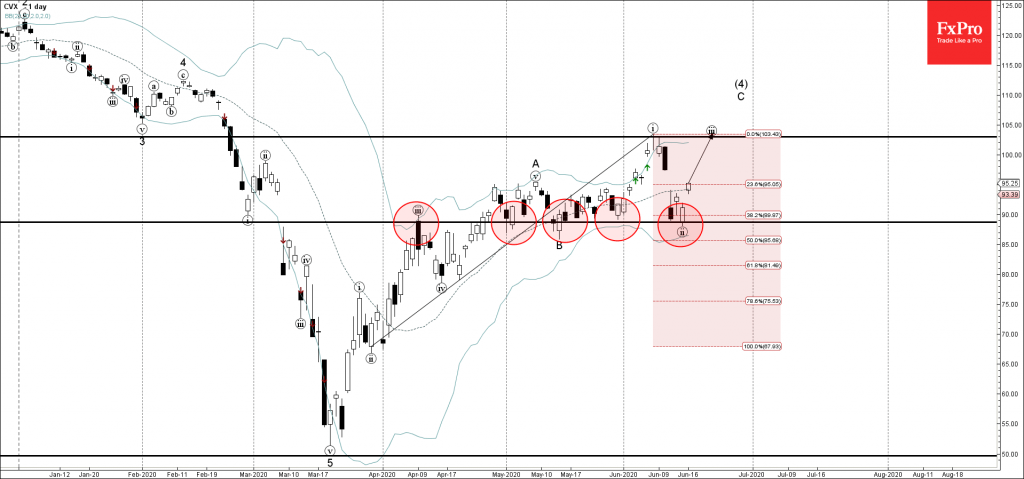
• Chevron reversed from multi-month support level 88.75
• Likely to rise 103.00

Chevron recently reversed up from the strong, multi-month support level 88.75 (former resistance from April, which has been reversing the price from May).

The support area near the support level 88.75 is strengthened by the lower daily Bollinger Band.

Chevron is likely to rise further toward the next round resistance level 103.00 (top of the previous impulse (i) and t

he target price for the completion of the active impulse wave (iii)).

The FxPro Tech Analysis Team

The FxPro technical experts prepare a daily analysis of the most active currency pairs (majors, crosses, exotics) and commodities. Selected instruments are reviewed on daily trends (D1, H4), using the active Elliott Wave setups, Japanese candlesticks, indicators, and support/resistance levels.

Share
Published by
The FxPro Tech Analysis Team
Tags: CVX2

Recent Posts

Nikkei 225 Wave Analysis – 4 April 2025

Nikkei 225: ⬇️ Sell - Nikkei 225 broke support zone - Likely to fall to…

2 days ago

Gold Wave Analysis – 4 April 2025

Gold: ⬇️ Sell - Gold broke daily up channel - Likely to fall to support…

2 days ago

Video Pro News Weekly

The U.S. dollar takes a major hit as trade tariffs spark capital flight, while global…

2 days ago

Mad Gold and Crude Oil

Gold experienced a significant increase followed by a sharp decline. It may be a good…

3 days ago

The US index’s demise has accelerated after confirming the downtrend

US indices fell after tough tariffs were announced by Trump, triggering a negative reaction in…

3 days ago

Tariff wars made the dollar a risky asset

The US dollar is experiencing a decline due to trade tariffs and capital flight. The…

3 days ago

This website uses cookies