Technical analysis

Chevron Wave Analysis – 15 January 2026

Chevron: ⬆️ Buy

– Chevron broke strong resistance level 165.00

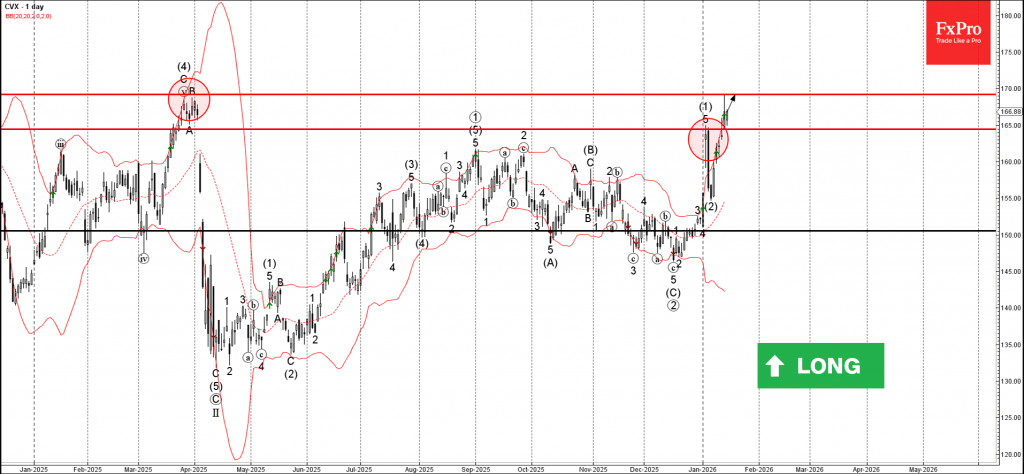
– Likely to rise to resistance level 168.90

Chevron recently broke above the strong resistance level 165.00 (which stopped the previous impulse wave (1) at the start of January).

The breakout of the resistance level 165.00 accelerated the active impulse wave (3) from the start of January.

Given the clear daily uptrend, Chevron can be expected to rise to the next resistance level 168.90 (former multi-month high from March).

The FxPro Tech Analysis Team

The FxPro technical experts prepare a daily analysis of the most active currency pairs (majors, crosses, exotics) and commodities. Selected instruments are reviewed on daily trends (D1, H4), using the active Elliott Wave setups, Japanese candlesticks, indicators, and support/resistance levels.

Share
Published by
The FxPro Tech Analysis Team
Tags: Chevron

Recent Posts

CHFJPY Wave Analysis – 15 January 2026

CHFJPY: ⬇️ Sell - CHFJPY reversed from resistance zone - Likely to fall to support level…

1 hour ago

WTI Crude Oil Wave Analysis – 15 January 2026

WTI Crude Oil: ⬇️ Sell - WTI Crude Oil rising inside minor impulse wave (1) -…

1 hour ago

Costco Wave Analysis – 15 January 2026

Costco: ⬆️ Buy - Costco rising inside minor impulse wave (1) - Likely to reach resistance…

1 hour ago

US Indices: growth widens, but are expectations too high?

Tech sell-off and high Q4 forecasts put the S&P 500 at risk; the Russell 2000…

7 hours ago

Markets pick up signals from the White House

Donald Trump has no intention of dismissing Jerome Powell. The White House's decision to postpone…

10 hours ago

Nat Gas Current situation #tradelikeapro #tradingshort #tradingtips #gas #tradingstrategy #trading

Today is Thursday, January 15th. Once again we will talk about the gas market. The…

10 hours ago

This website uses cookies