Categories: Technical analysis

Charles Schwab Corporation Wave Analysis – 08 January, 2020

  • Charles Schwab Corporation reversed from support area
  • Likely to rise to 49.00

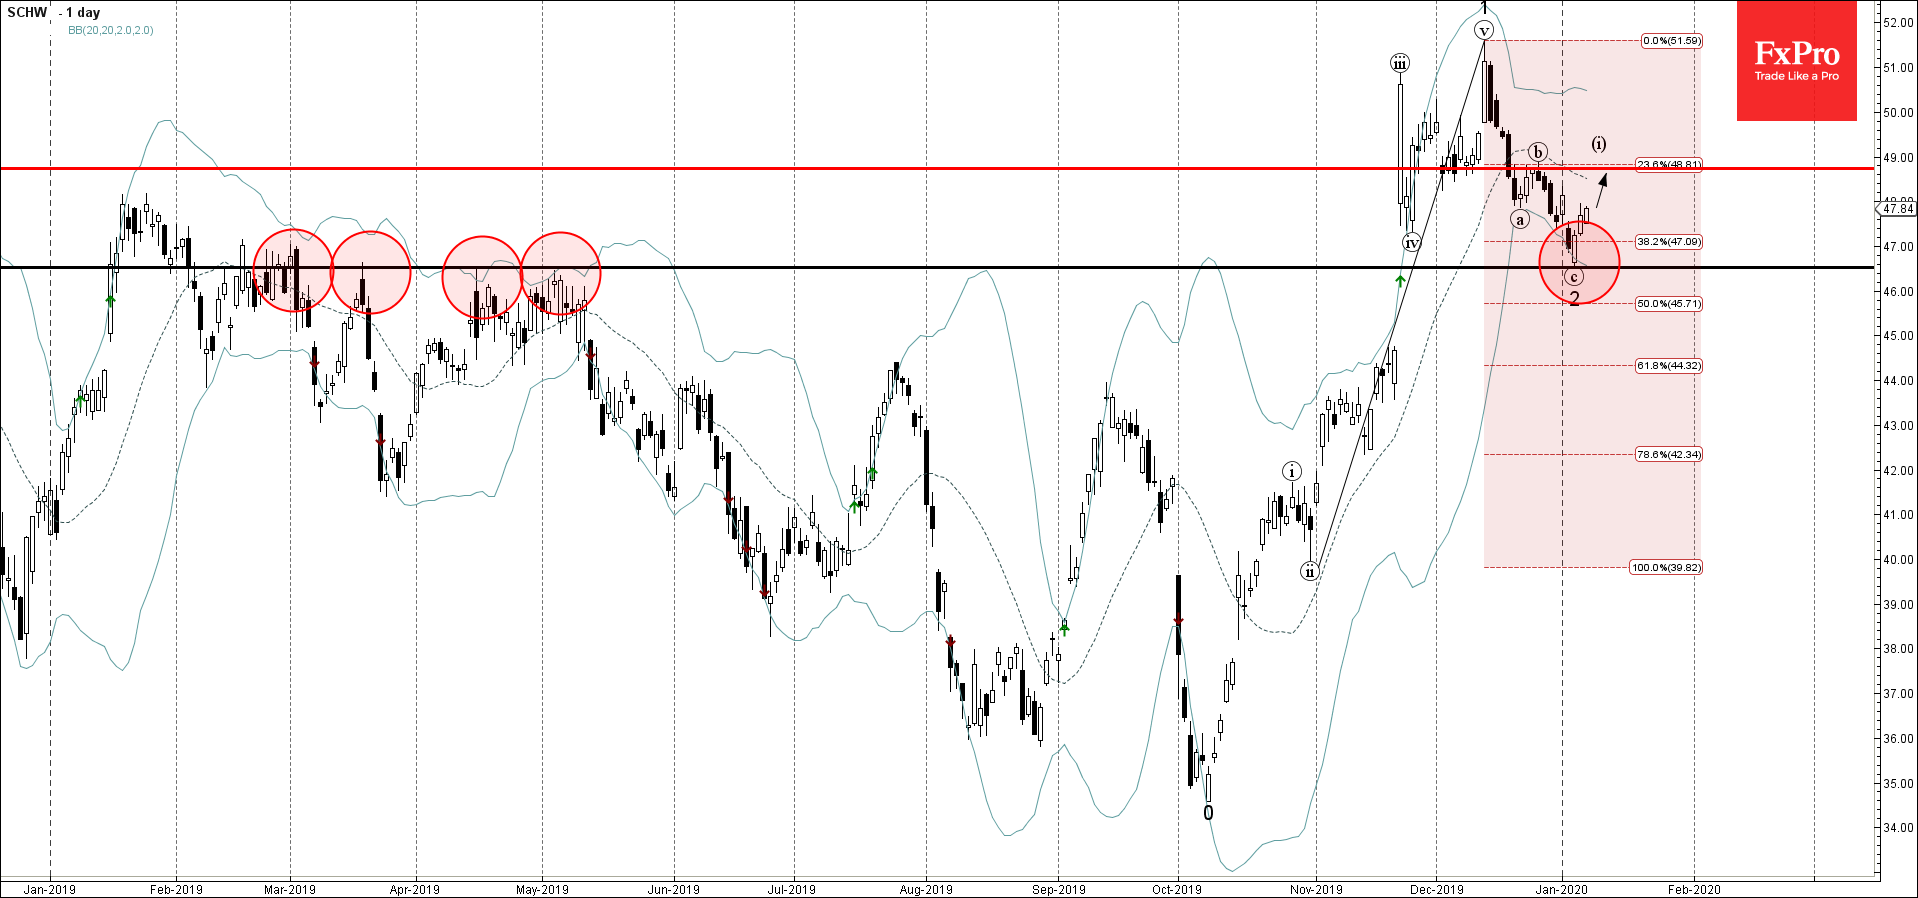
Charles Schwab Corporation recently reversed up from the support area lying between the strong support level 46.50 (former multi-month resistance level from last year) and the 38.22% Fibonacci correction of the previous sharp upward impulse 1.

The upward reversal from this support area started the active impulse wave 3.

Charles Schwab Corporation is likely to rise further toward the next resistance level 49.00 (top of the previous short-term correction (b) from December).

The FxPro Tech Analysis Team

The FxPro technical experts prepare a daily analysis of the most active currency pairs (majors, crosses, exotics) and commodities. Selected instruments are reviewed on daily trends (D1, H4), using the active Elliott Wave setups, Japanese candlesticks, indicators, and support/resistance levels.

Share
Published by
The FxPro Tech Analysis Team
Tags: SCHW

Recent Posts

AMD Wave Analysis – 10 April 2025

AMD: ⬇️ Sell - AMD reversed from resistance zone - Likely to fall to support…

9 hours ago

Gold Wave Analysis – 10 April 2025

Gold: ⬆️ Buy - Gold broke key resistance level 3150.00 - Likely to rise to…

9 hours ago

USDCHF Wave Analysis – 10 April 2025

USDCHF: ⬇️ Sell - USDCHF broke support zone - Likely to fall to support level…

9 hours ago

NZDUSD Wave Analysis – 10 April 2025

NZDUSD: ⬆️ Buy - NZDUSD reversed from support zone - Likely to rise to resistance…

9 hours ago

The dollar index breaks multi-year support

The dollar index returned to the lows of September last year after a brief surge…

16 hours ago

Crypto market stabilises after rebound

Market Picture The cryptocurrency market cap has stabilised near a key level since the start…

17 hours ago

This website uses cookies