Categories: Technical analysis

Chainlink Wave Analysis – 12 August 2025

Chainlink: ⬆️ Buy

– Chainlink broke the resistance zone

– Likely to rise to resistance level 26.00

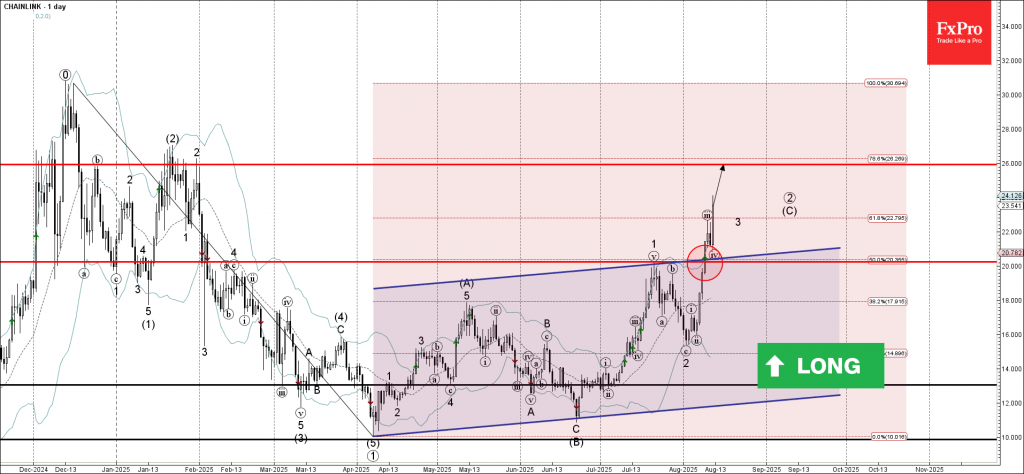
Chainlink cryptocurrency recently broke the resistance zone between the round resistance level 20.00, the resistance trendline of the daily up channel from April and the 50% Fibonacci correction of the downward impulse from December.

The price just reversed up from this price zone (acting as the support zone after it was broken) and continues to rise inside the active impulse wave (3).

Chainlink cryptocurrency can be expected to rise further to the next resistance level 26.00, which is the former strong resistance from January.

The FxPro Tech Analysis Team

The FxPro technical experts prepare a daily analysis of the most active currency pairs (majors, crosses, exotics) and commodities. Selected instruments are reviewed on daily trends (D1, H4), using the active Elliott Wave setups, Japanese candlesticks, indicators, and support/resistance levels.

Share
Published by
The FxPro Tech Analysis Team
Tags: Chainlink

Recent Posts

CHFJPY Wave Analysis – 9 January 2026

CHFJPY: ⬆️ Buy - CHFJPY reversed from support area - Likely to rise to resistance…

2 days ago

Exxon Mobil Wave Analysis – 9 January 2026

Exxon Mobil: ⬆️ Buy - Exxon Mobil reversed from support area - Likely to rise…

2 days ago

Pro News Weekly: Dollar Rebounds as Markets Test New Limits

Welcome to Pro News Weekly! Here’s what is shaping the markets: 💵 The U.S. dollar…

2 days ago

Geopolitics will destroy the euro

•    EURUSD falls due to geopolitics and expectations of tariff removal •    Gold returns to…

2 days ago

Platinum Wave Analysis – 8 January 2026

Platinum: ⬇️ Sell - Platinum reversed from pivotal resistance level 150.00 - Likely to fall to…

3 days ago

Baidu Wave Analysis – 8 January 2026

Baidu: ⬇️ Sell - Baidu reversed from resistance zone - Likely to fall to support level…

3 days ago

This website uses cookies