Categories: Technical analysis

Caterpillar Wave Analysis 5 October, 2020

• Caterpillar reversed from support area

• Likely to rise to 155.00

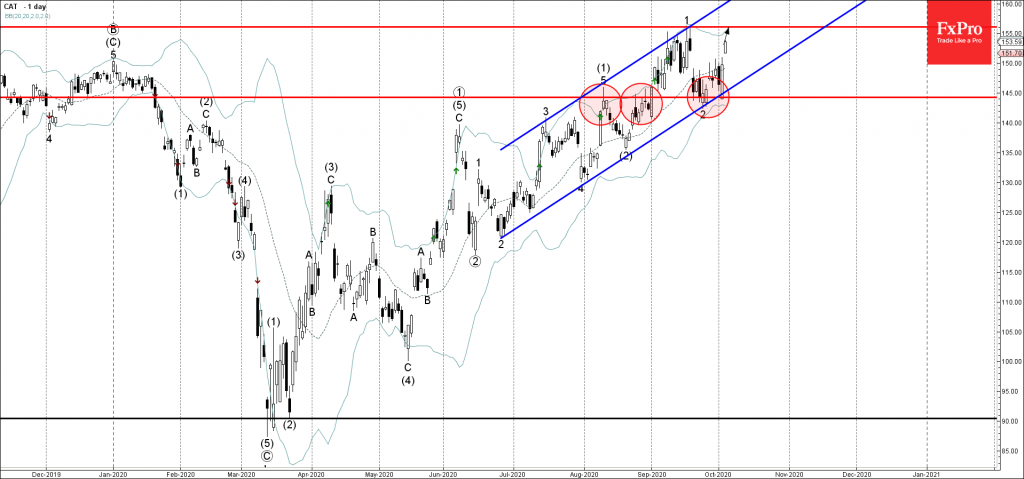
Caterpillar recently reversed up sharply with the candlesticks reversal pattern Bullish Engulfing from the support area lying between the pivotal support level 145.00, lower daily Bollinger Band and the support trendline of the daily up channel from June.

The price is currently moving inside the short-term impulse wave 3 – which belongs to the medium-term impulse sequence (3) from August.

Given the clear uptrend – Caterpillar price is likely to rise toward the next resistance level 155.00 (which reversed the price multiple times in September).

The FxPro Tech Analysis Team

The FxPro technical experts prepare a daily analysis of the most active currency pairs (majors, crosses, exotics) and commodities. Selected instruments are reviewed on daily trends (D1, H4), using the active Elliott Wave setups, Japanese candlesticks, indicators, and support/resistance levels.

Share
Published by
The FxPro Tech Analysis Team
Tags: caterpillar

Recent Posts

Gold shines on an anti-fiat thesis

The dollar suffered due to threats to the Fed’s independence. Gold managed to renew its…

5 hours ago

SP500 Current situation #trading #tradelikeapro #sp500 #tradingshorts #tradingstrategy

Today is Monday, the 12th of January, and once again we will talk about the…

5 hours ago

Crypto: sell-the-growth continues

Crypto markets remain volatile; Bitcoin faces selling pressure, XRP slips, Monero surges, and market signals…

7 hours ago

CHFJPY Wave Analysis – 9 January 2026

CHFJPY: ⬆️ Buy - CHFJPY reversed from support area - Likely to rise to resistance…

3 days ago

Exxon Mobil Wave Analysis – 9 January 2026

Exxon Mobil: ⬆️ Buy - Exxon Mobil reversed from support area - Likely to rise…

3 days ago

Pro News Weekly: Dollar Rebounds as Markets Test New Limits

Welcome to Pro News Weekly! Here’s what is shaping the markets: 💵 The U.S. dollar…

3 days ago

This website uses cookies