Categories: Technical analysis

Caterpillar Wave Analysis – 25 March, 2020

  • Caterpillar reversed from resistance zone
  • Likely to fall to 80.00

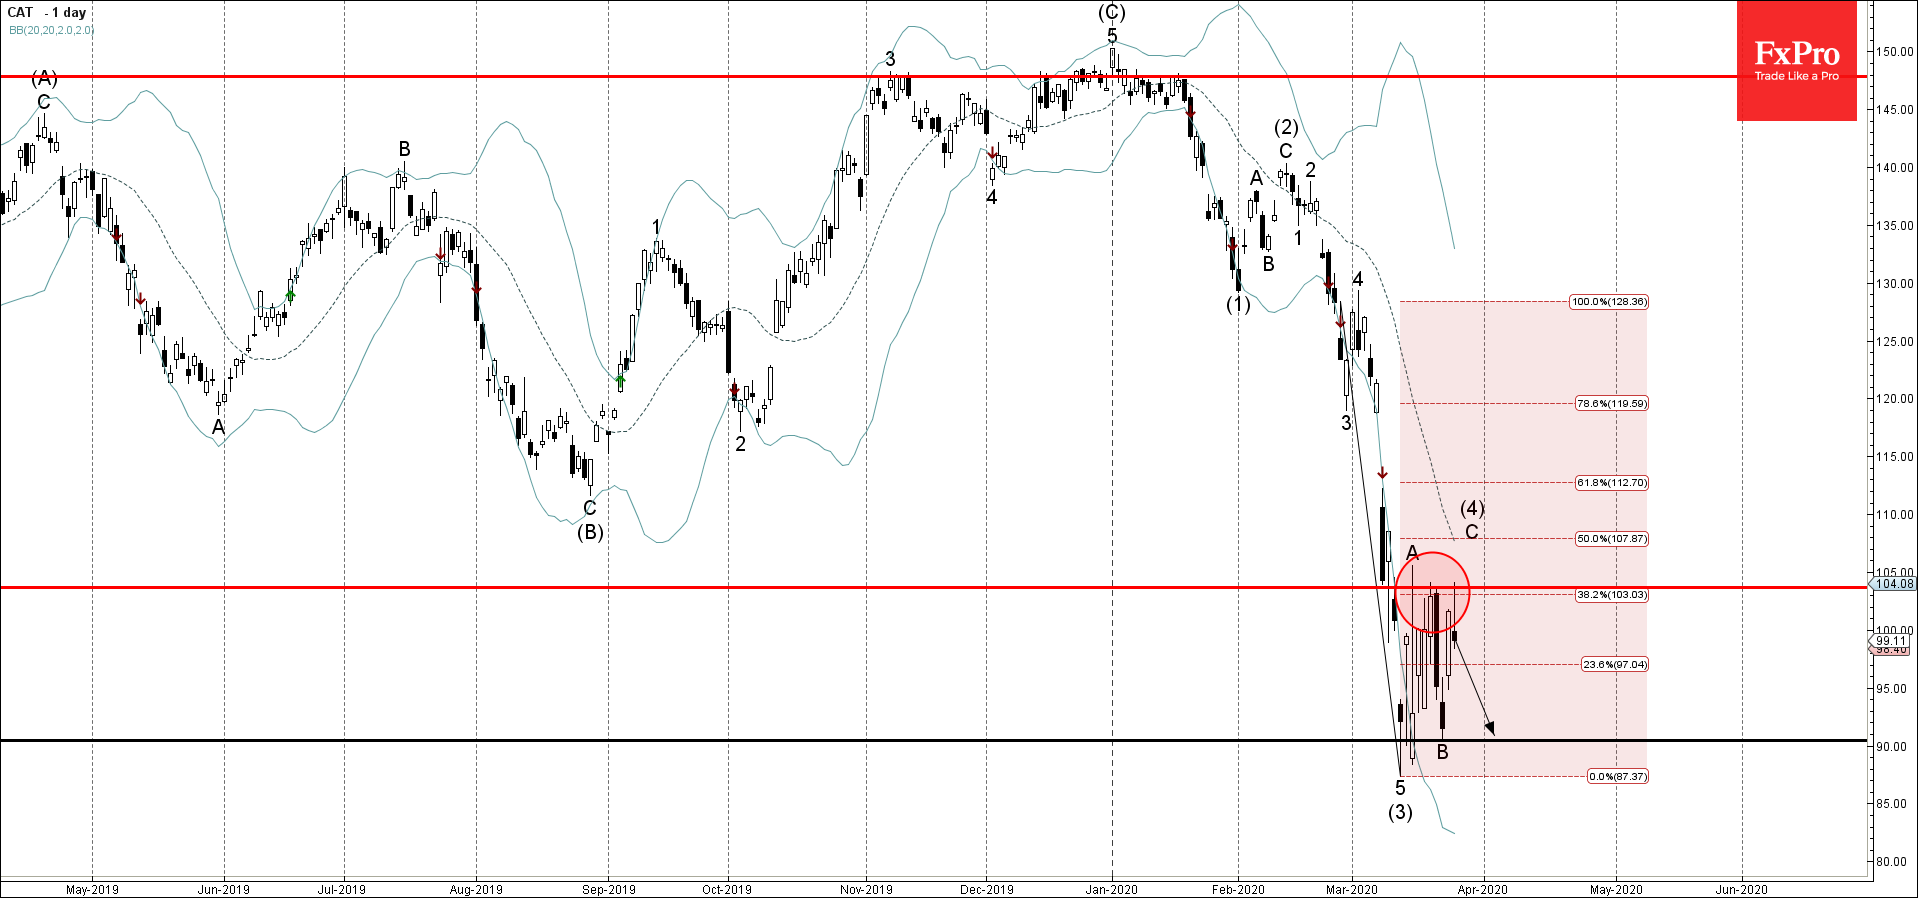
Caterpillar recently reversed down from the resistance zone located between the pivotal resistance level 103.65 (which has been reversing the price from the middle of March) and the 38.2% Fibonacci correction of the previous impulse wave 5 from the start of this month.

The price will form the daily Shooting Star if it closes today near the current levels (Caterpillar formed daily “Shooting Star” and “Bearish Engulfing” the last 2 times it approached the resistance level 103.65).

Caterpillar is likely to correct down further toward the next support level 80.00 (which recently stopped the B-wave of the active ABC correction (4)).

The FxPro Tech Analysis Team

The FxPro technical experts prepare a daily analysis of the most active currency pairs (majors, crosses, exotics) and commodities. Selected instruments are reviewed on daily trends (D1, H4), using the active Elliott Wave setups, Japanese candlesticks, indicators, and support/resistance levels.

Share
Published by
The FxPro Tech Analysis Team
Tags: CAT

Recent Posts

Bitcoin Wave Analysis – 14 January 2026

Bitcoin: ⬆️ Buy - Bitcoin broke resistance area - Likely to rise to resistance level…

1 hour ago

NZDJPY Wave Analysis – 14 January 2026

NZDJPY: ⬇️ Sell - NZDJPY reversed down from the resistance area - Likely to fall…

1 hour ago

The dollar does not tolerate dissent

US GDP growth is driven not by the White House, but by AI. The Bank…

11 hours ago

The crypto market has made a breakthrough

The crypto market surges, hitting new highs, with bullish sentiment for Bitcoin and Ethereum amid…

12 hours ago

Brent Crude oil Wave Analysis – 13 January 2026

Brent Crude oil ⬆️ Buy - Brent Crude oil rising inside impulse wave c -…

1 day ago

USDJPY Wave Analysis – 13 January 2026

USDJPY ⬆️ Buy - USDJPY broke resistance area - Likely to rise to resistance level…

1 day ago

This website uses cookies