Categories: Technical analysis

Caterpillar Wave Analysis – 17 July 2025

Caterpillar: ⬆️ Buy

– Caterpillar broke long-term resistance level 410.00

– Likely to rise to resistance level 440.00

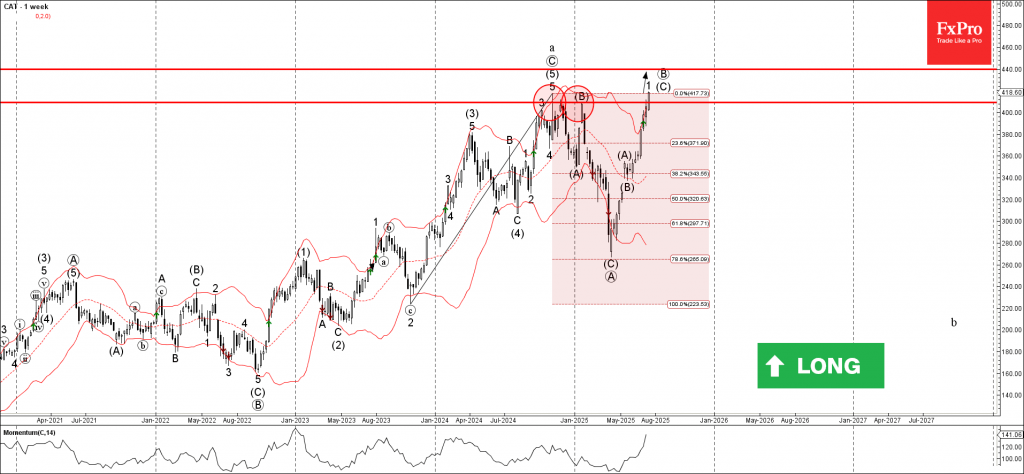
Caterpillar recently broke above the major long-term resistance level 410.00, which has been reversing the price from the end of 2024, as can be seen from the weekly Caterpillar chart below.

The breakout of the resistance level 410.00 accelerated the active intermediate impulse wave (C) from the middle of 2025.

Given the overriding weekly uptrend and the accelerating weekly Momentum, Caterpillar can be expected to rise to the next resistance level 440.00 (target for the completion of the active intermediate impulse wave (C)).

The FxPro Tech Analysis Team

The FxPro technical experts prepare a daily analysis of the most active currency pairs (majors, crosses, exotics) and commodities. Selected instruments are reviewed on daily trends (D1, H4), using the active Elliott Wave setups, Japanese candlesticks, indicators, and support/resistance levels.

Share
Published by
The FxPro Tech Analysis Team
Tags: caterpillar

Recent Posts

Geopolitics will destroy the euro

•    EURUSD falls due to geopolitics and expectations of tariff removal •    Gold returns to…

6 hours ago

Platinum Wave Analysis – 8 January 2026

Platinum: ⬇️ Sell - Platinum reversed from pivotal resistance level 150.00 - Likely to fall to…

19 hours ago

Baidu Wave Analysis – 8 January 2026

Baidu: ⬇️ Sell - Baidu reversed from resistance zone - Likely to fall to support level…

19 hours ago

EURUSD Wave Analysis – 8 January 2026

EURUSD: ⬇️ Sell - EURUSD broke daily up channel - Likely to fall to support…

21 hours ago

WTI crude oil Wave Analysis – 8 January 2026

WTI crude oil: ⬆️ Buy - WTI crude oil reversed from support zone - Likely…

21 hours ago

Do not underestimate dollar

Positive macro statistics for the US are helping the greenback. Gold could rise to $4,610…

1 day ago

This website uses cookies