Categories: Technical analysis

Catepillar Wave Analysis – 12 December, 2019

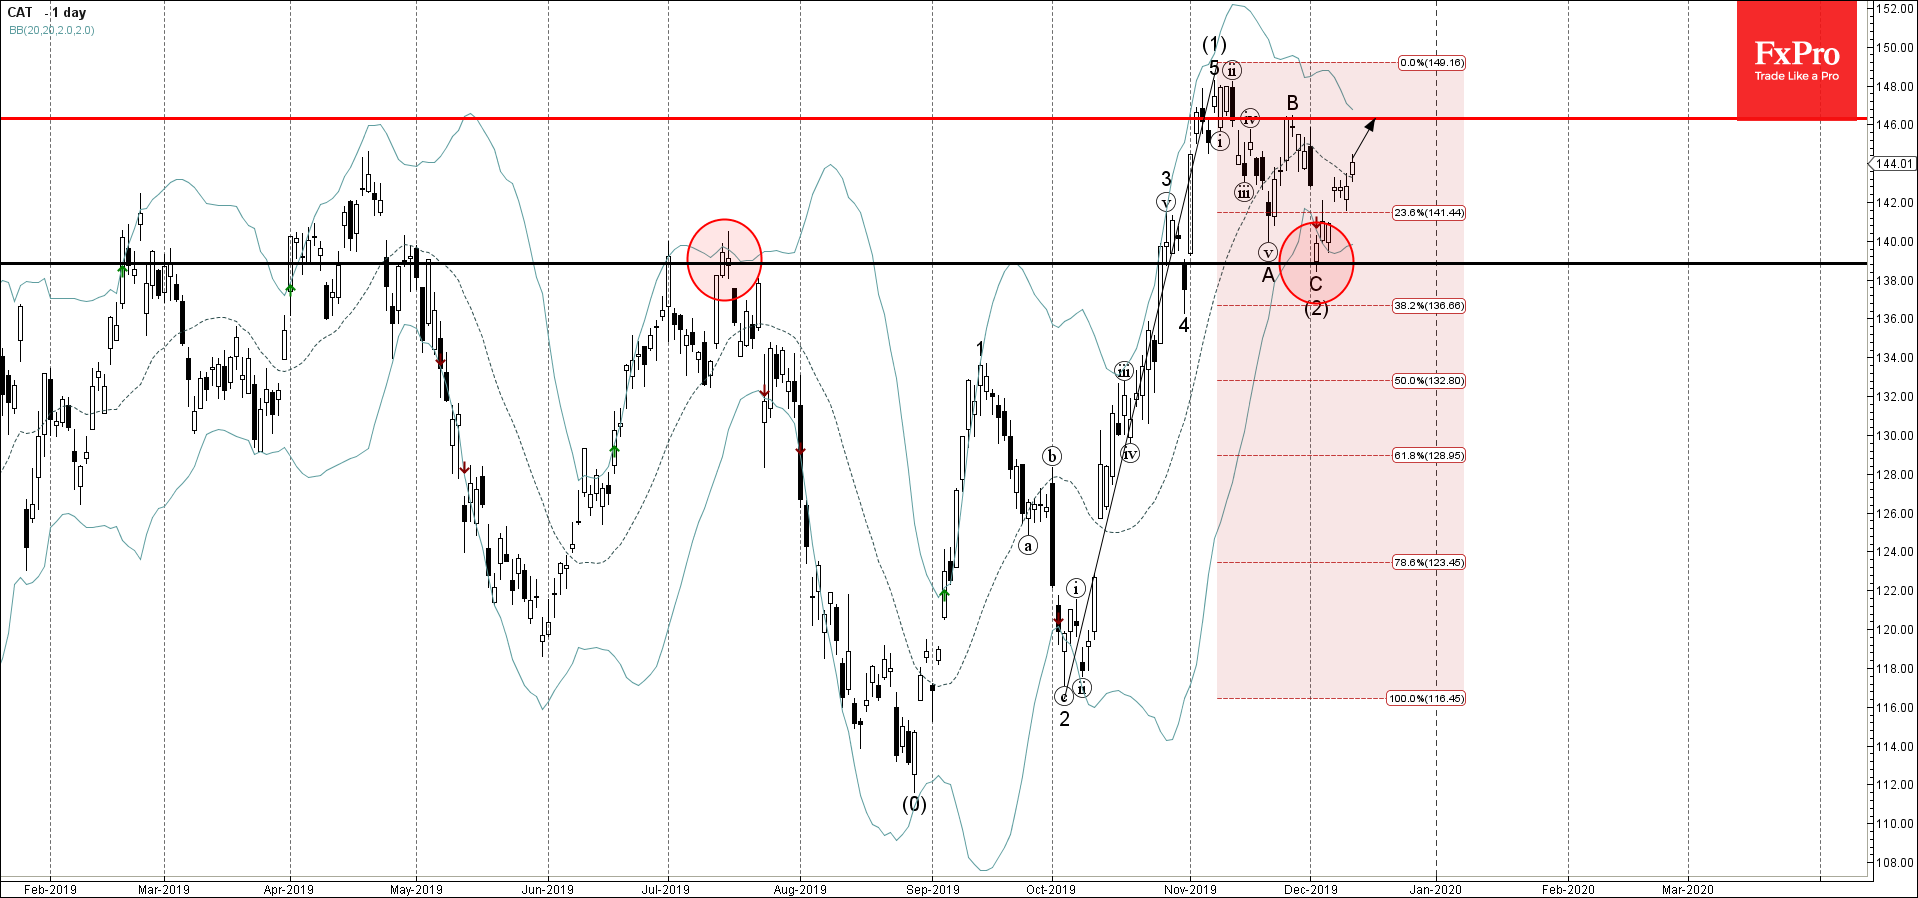
  • Catepillar reversed from support area
  • Likely to rise to 146.00

Catepillar recently reversed up from the support area lying between the support level 139.00 (former resistance from July) and the lower daily Bollinger Band.

The upward reversal from this support area started the active medium-term impulse wave (3).

Catepillar is expected to rise further toward the next resistance level 146.00 (top of the previous wave B from November).

AddThis Website Tools
The FxPro Tech Analysis Team

The FxPro technical experts prepare a daily analysis of the most active currency pairs (majors, crosses, exotics) and commodities. Selected instruments are reviewed on daily trends (D1, H4), using the active Elliott Wave setups, Japanese candlesticks, indicators, and support/resistance levels.

Share
Published by
The FxPro Tech Analysis Team
Tags: CAT

Recent Posts

USDJPY Wave Analysis – 24 March 2025

USDJPY: ⬆️ Buy - USDJPY broke the resistance zone - Likely to rise to the…

5 hours ago

Dow Jones Wave Analysis – 24 March 2025

Dow Jones: ⬆️ Buy - Dow Jones reversed from support zone - Likely to rise…

5 hours ago

Bitcoin pushes up from 200-day MA

Bitcoin pushed back from its 200-day low, with the crypto market capitalization rising to $2.86…

8 hours ago

Video: Market Shake-Up! Dollar, Bitcoin & Gold on the Move – What’s Next?

Big moves are brewing in the markets! 📉📈 The US Dollar is forming a bottom,…

14 hours ago

Tesla Wave Analysis – 21 March 2025

Tesla: ⬆️ Buy - Tesla reversed from support level 220.00 - Likely to rise to…

3 days ago

Google Wave Analysis – 21 March 2025

Google: ⬆️ Buy - Google reversed from key support level 160.00 - Likely to rise…

3 days ago