Categories: Technical analysis

CADJPY Wave Analysis 7 December, 2020

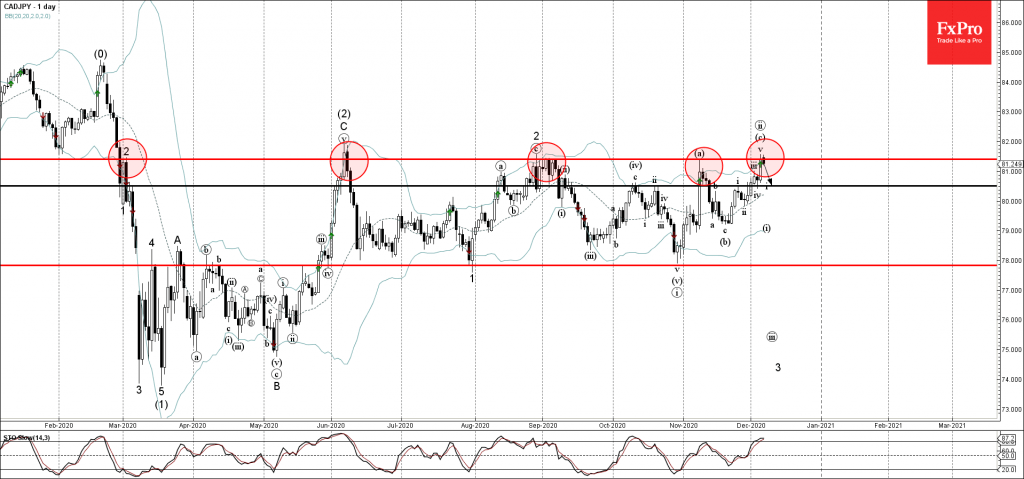
• CADJPY reversed from long-term resistance level 81.40

• Likely to fall to 80.50

CADJPY previously reversed down from the long-term resistance level 81.40 (which reversed the price multiple times from the start of March as can be seen below).

The resistance area near the resistance level 81.40 was strengthened by the upper daily Bollinger Band.

Given the overbought daily Stochastic and the strength of the resistance level 81.40 – CADJPY is expected to fall further toward the next support level 80.50 (target price for the completion of the active impulse wave i).

The FxPro Tech Analysis Team

The FxPro technical experts prepare a daily analysis of the most active currency pairs (majors, crosses, exotics) and commodities. Selected instruments are reviewed on daily trends (D1, H4), using the active Elliott Wave setups, Japanese candlesticks, indicators, and support/resistance levels.

Share
Published by
The FxPro Tech Analysis Team
Tags: CADJPY

Recent Posts

Gold shines on an anti-fiat thesis

The dollar suffered due to threats to the Fed’s independence. Gold managed to renew its…

5 hours ago

SP500 Current situation #trading #tradelikeapro #sp500 #tradingshorts #tradingstrategy

Today is Monday, the 12th of January, and once again we will talk about the…

5 hours ago

Crypto: sell-the-growth continues

Crypto markets remain volatile; Bitcoin faces selling pressure, XRP slips, Monero surges, and market signals…

7 hours ago

CHFJPY Wave Analysis – 9 January 2026

CHFJPY: ⬆️ Buy - CHFJPY reversed from support area - Likely to rise to resistance…

3 days ago

Exxon Mobil Wave Analysis – 9 January 2026

Exxon Mobil: ⬆️ Buy - Exxon Mobil reversed from support area - Likely to rise…

3 days ago

Pro News Weekly: Dollar Rebounds as Markets Test New Limits

Welcome to Pro News Weekly! Here’s what is shaping the markets: 💵 The U.S. dollar…

3 days ago

This website uses cookies