Categories: Technical analysis

CADJPY Wave Analysis 5 October 2023

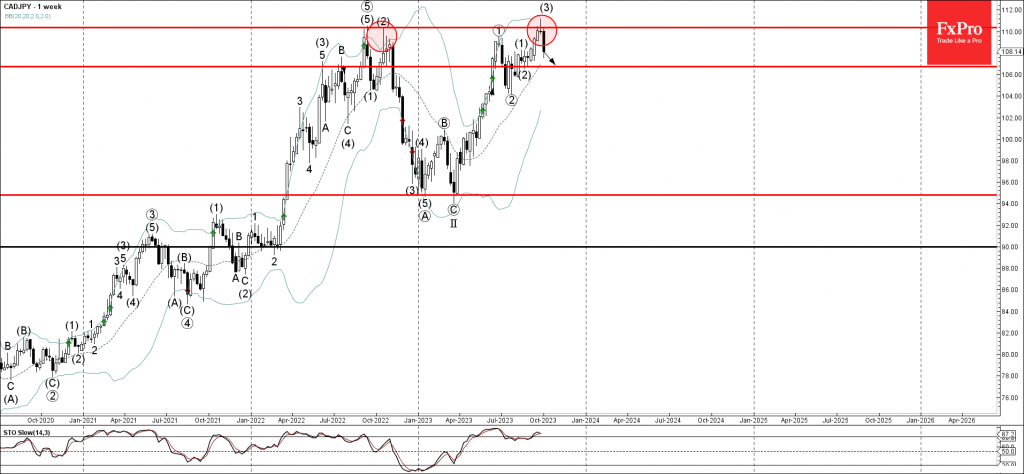
– CADJPY reversed from powerful resistance level 110.35

– Likely to fall to support level 106.7

CADJPY currency pair recently reversed down from the powerful resistance level 110.35 (which stopped the previous weekly uptrend in 2022) standing near the upper weekly daily Bollinger Band.

The downward reversal from the resistance level 110.35 is currently forming the weekly Evening Star – strong sell signal for this currency pair.

Given the bearish divergence one the weekly Stochastic, CADJPY currency pair can be expected to fall further toward the next support level 106.7.

The FxPro Tech Analysis Team

The FxPro technical experts prepare a daily analysis of the most active currency pairs (majors, crosses, exotics) and commodities. Selected instruments are reviewed on daily trends (D1, H4), using the active Elliott Wave setups, Japanese candlesticks, indicators, and support/resistance levels.

Share
Published by
The FxPro Tech Analysis Team
Tags: CADJPY

Recent Posts

Pro News Weekly: Market Shake-Up, Dollar Drops, Gold Surges, Bitcoin Wobbles!

Welcome to Pro News Flash! 💵 The U.S. dollar slips 🏆 Major stock indices struggle…

3 hours ago

Solana Wave Analysis – 5 December 2025

Solana: ⬇️ Sell - Solana reversed from resistance zone - Likely to fall to support…

4 hours ago

EURAUD Wave Analysis – 5 December 2025

EURAUD : ⬇️ Sell - EURAUD broke the support level 1.7600 - Likely to fall…

4 hours ago

Forex has set its priorities

In 2026, experts favour the yen, see modest euro growth, and expect pressure on the…

8 hours ago

Bear market rebound in crypto is likely to continue

Crypto rebounds continue; Bitcoin faces resistance, with a mixed market outlook ahead, as regulatory changes…

9 hours ago

Coca-Cola Wave Analysis – 4 December 2025

Coca-Cola: ⬇️ Sell - Coca-Cola reversed from long-term resistance level 73.25 - Likely to fall to…

22 hours ago

This website uses cookies