Categories: Technical analysis

CADJPY Wave Analysis – 30 October 2025

CADJPY: ⬆️ Buy

– CADJPY broke resistance zone

– Likely to rise to resistance level 111.30

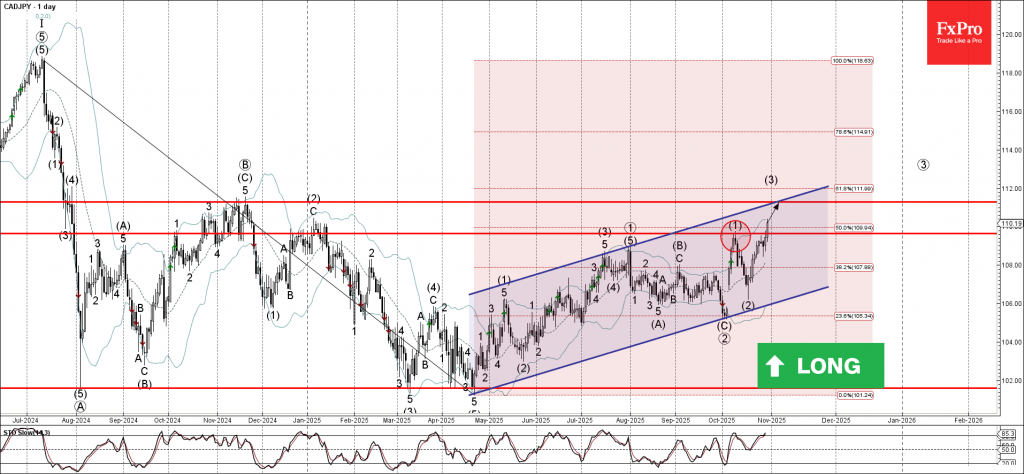
CADJPY currency pair recently broke the resistance zone between the resistance level 109.60 (which stopped wave (1) at the start of October) and the 50% Fibonacci correction of the downtrend from July of 2024.

The breakout of this resistance zone accelerated the active intermediate impulse sequence (3) from the middle of October.

Given the clear daily uptrend, CADJPY currency pair can be expected to rise further to the next resistance level 111.30 (former multi-month high from November).

The FxPro Tech Analysis Team

The FxPro technical experts prepare a daily analysis of the most active currency pairs (majors, crosses, exotics) and commodities. Selected instruments are reviewed on daily trends (D1, H4), using the active Elliott Wave setups, Japanese candlesticks, indicators, and support/resistance levels.

Share
Published by
The FxPro Tech Analysis Team
Tags: CADJPY

Recent Posts

Bitcoin. Current situation #tradelikeapro #trading #cryptocurrency #bitcoin #tradingshorts

Today is January 2nd, and this is a Bitcoin market review for FX Pro. #tradelikeapro…

4 hours ago

EURJPY Wave Analysis – 31 December 2025

EURJPY: ⬆️ Buy - EURJPY reversed from support area - Likely to rise to resistance…

2 days ago

Binance Coin Wave Analysis – 31 December 2025

Binance Coin: ⬆️ Buy - Binance Coin broke Descending Triangle - Likely to rise to…

2 days ago

Uniswap Wave Analysis – 31 December 2025

Uniswap: ⬇️ Sell - Uniswap reversed from resistance area - Likely to fall to support…

2 days ago

S&P 500 Wave Analysis – 31 December 2025

S&P 500: ⬇️ Sell - S&P 500 reversed from strong resistance level 6935.00 - Likely…

2 days ago

The dollar may defy expectations

•  The return of American exceptionalism will help the greenback. •  The yen will start…

2 days ago

This website uses cookies