- CADJPY reversed from support area
- Further gains are likely
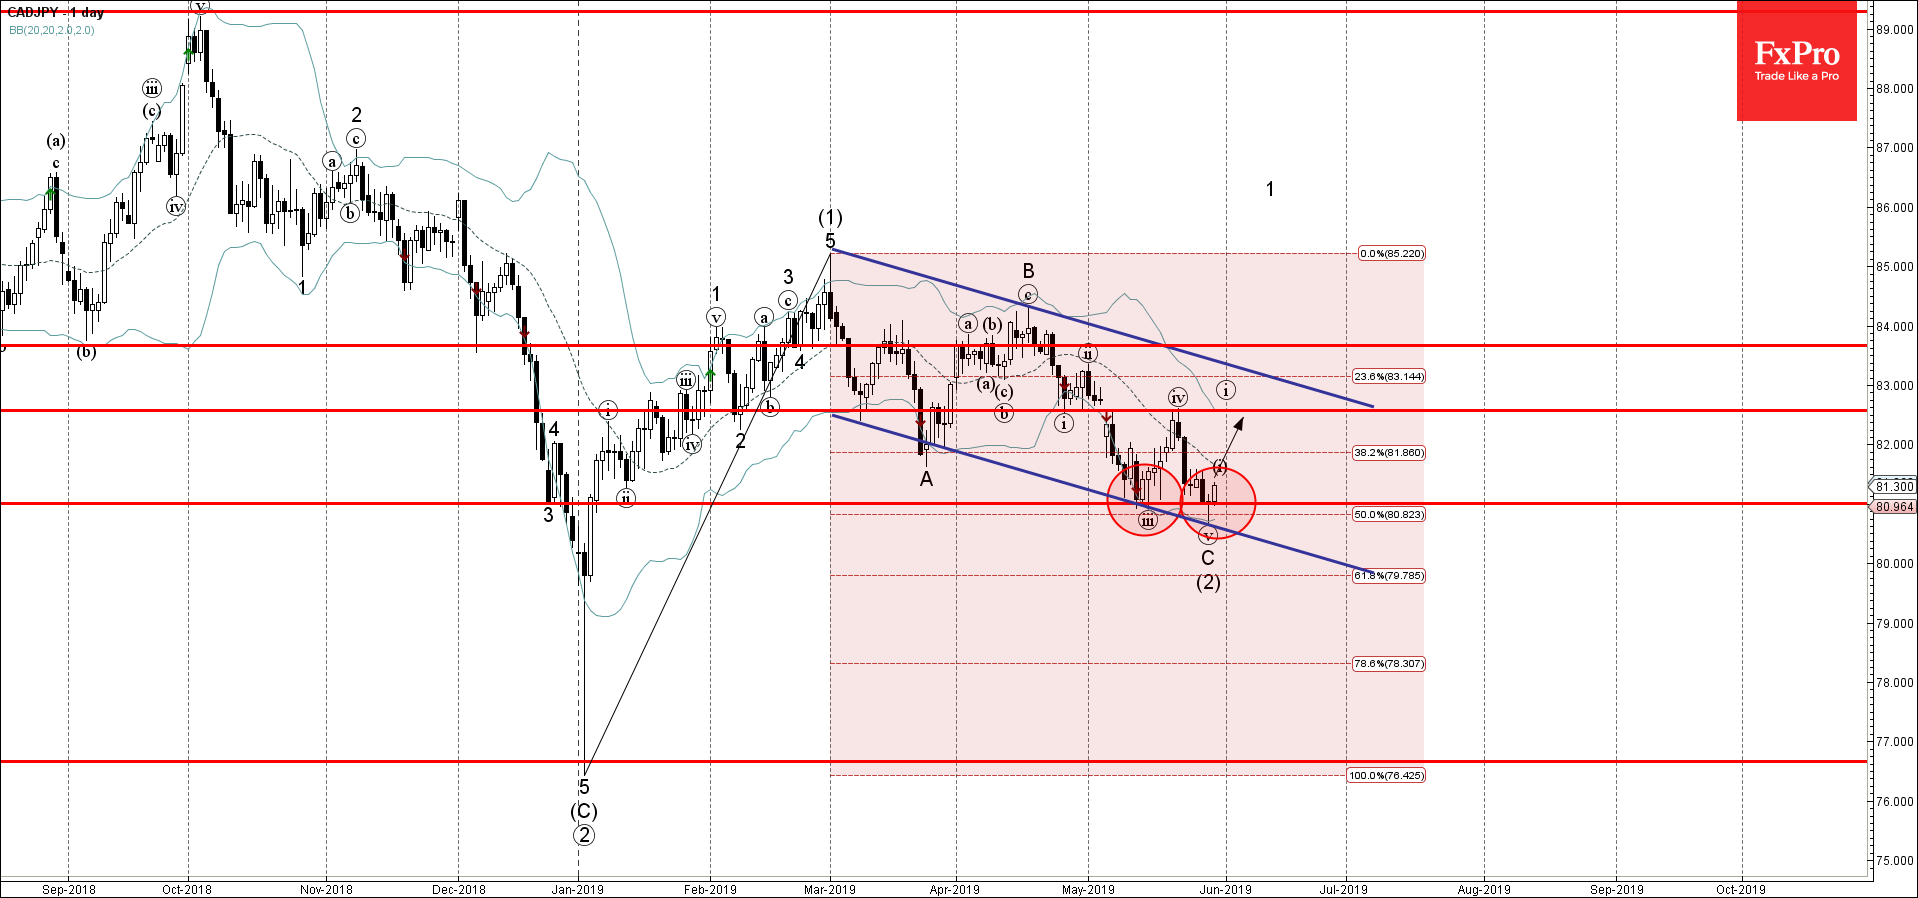
CADJPY recently reversed up from the support area lying between the support level 81.00 (low of the previous wave (ii)), lower daily Bollinger Band and the support trendline of the daily down channel from March.
The upward reversal from this support area created the daily Japanese candlesticks reversal pattern Hammer.
CADJPY is expected to rise further inside the active impulse wave (3) and retest the next resistance level 82.60 (top of the previous correction (iv)).