Categories: Technical analysis

CADJPY Wave Analysis – 3 August, 2022

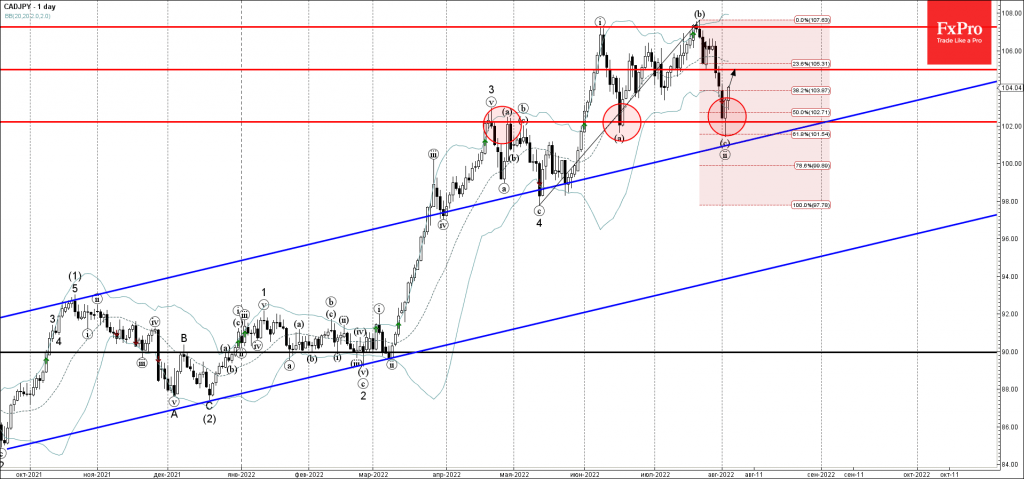
• CADJPY reversed from support level 102.00

• Likely to rise to resistance level 105.00

CADJPY currency pair recently reversed up from the key support level 102.00 (former resistance from April, which stopped the earlier minor correction (a) in June).

The support zone near the support level 102.00 was strengthened by the lower daily Bollinger Band and by the 50% Fibonacci correction of the upward impulse from May.

Given the strong daily uptrend, CADJPY currency pair can be expected to rise in the active impulse wave (iii) toward the next resistance level 105.00 (former support from last month).

AddThis Website Tools
The FxPro Tech Analysis Team

The FxPro technical experts prepare a daily analysis of the most active currency pairs (majors, crosses, exotics) and commodities. Selected instruments are reviewed on daily trends (D1, H4), using the active Elliott Wave setups, Japanese candlesticks, indicators, and support/resistance levels.

Share
Published by
The FxPro Tech Analysis Team
Tags: CADJPY

Recent Posts

Bitcoin Wave Analysis – 22 April 2025

Bitcoin: ⬆️ Buy - Bitcoin broke round resistance level 90000.00 - Likely to rise to…

11 hours ago

AUDUSD Wave Analysis – 22 April 2025

AUDUSD: ⬇️ Sell - AUDUSD reversed from the key resistance level 0.6400 - Likely to…

11 hours ago

Crypto Market Escapes from Fear

Market Overview The crypto market has gained around 2% over the past seven days, with…

23 hours ago

Nike Wave Analysis – 21 April 2025

Nike: ⬆️ Buy - Nike reversed from the long-term support level 52.60 - Likely to…

1 day ago

Natural Gas Wave Analysis – 21 April 2025

Natural gas: ⬇️ Sell Natural gas broke support area Likely to fall to support level…

1 day ago

EURUSD Wave Analysis – 21 April 2025

EURUSD: ⬆️ Buy - EURUSD broke the resistance area - Likely to test resistance level…

2 days ago