Categories: Technical analysis

CADJPY Wave Analysis – 27 March 2023

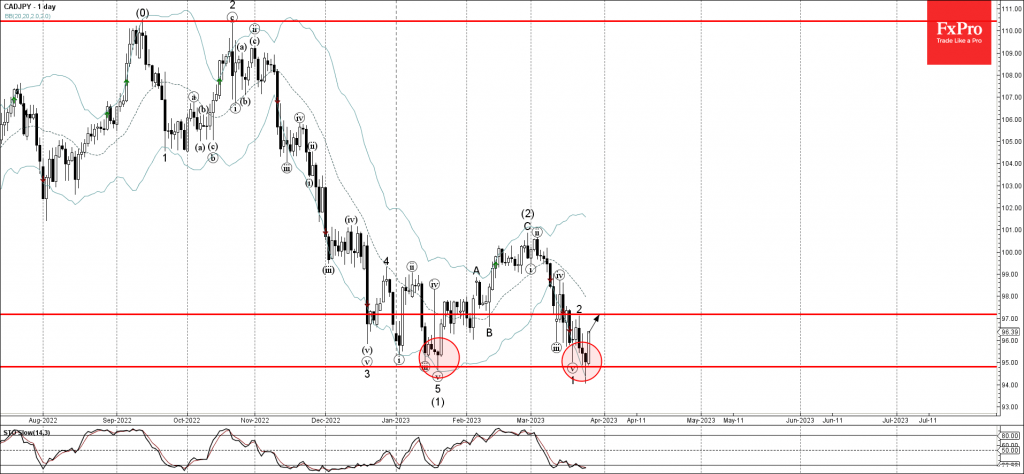
• CADJPY reversed from support level 94.80

• Likely to rise to resistance level 97.00

CADJPY previous reversed up from major support level 94.80 (which stopped the previous sharp downtrend in the middle of January), standing near the lower daily Bollinger Band.

The upward reversal from the support level 94.80 created the daily Japanese candlesticks reversal pattern Hammer – similar to the one the pair created in January.

Given the oversold daily Stochastic and the strong yen sales, CADJPY can then be expected to rise further toward the next resistance level 97.00 (top of the previous correction 2).

The FxPro Tech Analysis Team

The FxPro technical experts prepare a daily analysis of the most active currency pairs (majors, crosses, exotics) and commodities. Selected instruments are reviewed on daily trends (D1, H4), using the active Elliott Wave setups, Japanese candlesticks, indicators, and support/resistance levels.

Share
Published by
The FxPro Tech Analysis Team
Tags: CADJPY

Recent Posts

Pro News Weekly: Market Shake-Up, Dollar Drops, Gold Surges, Bitcoin Wobbles!

Welcome to Pro News Flash! 💵 The U.S. dollar slips 🏆 Major stock indices struggle…

4 hours ago

Solana Wave Analysis – 5 December 2025

Solana: ⬇️ Sell - Solana reversed from resistance zone - Likely to fall to support…

5 hours ago

EURAUD Wave Analysis – 5 December 2025

EURAUD : ⬇️ Sell - EURAUD broke the support level 1.7600 - Likely to fall…

5 hours ago

Forex has set its priorities

In 2026, experts favour the yen, see modest euro growth, and expect pressure on the…

10 hours ago

Bear market rebound in crypto is likely to continue

Crypto rebounds continue; Bitcoin faces resistance, with a mixed market outlook ahead, as regulatory changes…

11 hours ago

Coca-Cola Wave Analysis – 4 December 2025

Coca-Cola: ⬇️ Sell - Coca-Cola reversed from long-term resistance level 73.25 - Likely to fall to…

24 hours ago

This website uses cookies