Categories: Technical analysis

CADJPY Wave Analysis 25 September 2024

– CADJPY reversed from support area

– Likely to rise to resistance level 108.85

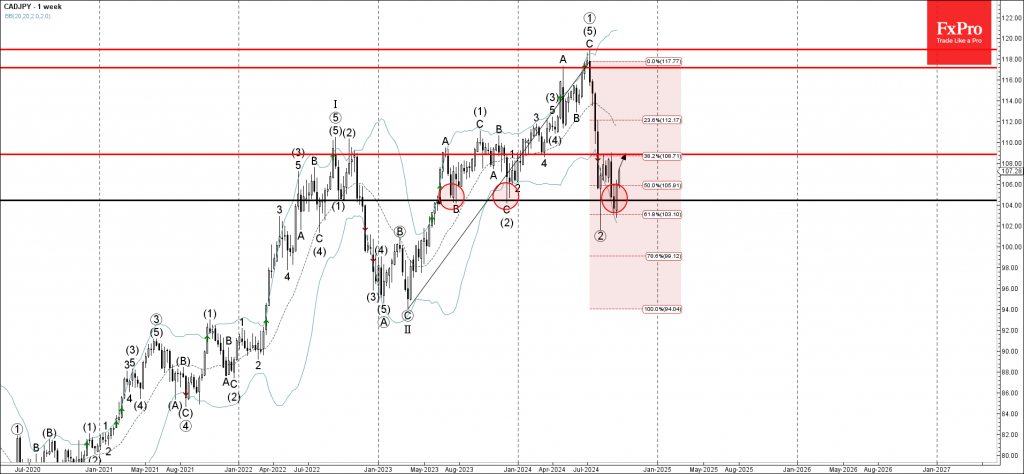
CADJPY currency pair earlier reversed up with the weekly Bullish Engulfing from the support area located between the pivotal resistance level 104.50 (which has been reversing the pair from the middle of August, and the lower weekly Bollinger Band.

This support area was further strengthened by the 61.8% Fibonacci correction of the upward impulse from the start of 2023.

Given the clear weekly uptrend and the continued Canadian dollar bullishness seen across the FX markets, CADJPY currency pair can be expected to rise further to the next resistance level 108.85.

The FxPro Tech Analysis Team

The FxPro technical experts prepare a daily analysis of the most active currency pairs (majors, crosses, exotics) and commodities. Selected instruments are reviewed on daily trends (D1, H4), using the active Elliott Wave setups, Japanese candlesticks, indicators, and support/resistance levels.

Share
Published by
The FxPro Tech Analysis Team
Tags: CADJPY

Recent Posts

EURUSD Wave Analysis 25 September 2024

- EURUSD reversed from resistance area - Likely to fall to support level 1.1100 EURUSD…

2 hours ago

Dollar tests psychological support

The Dollar Index (DXY) is rising after dipping below the 100 level, attracting buyers but…

5 hours ago

Crypto market tests one-month high

The crypto market rose 1.2% in 24 hours to $2.25 trillion, approaching one-month highs and…

11 hours ago

USDCHF Wave Analysis 24 September 2024

- USDCHF reversed from resistance area - Likely to fall to support level 0.8400 USDCHF…

23 hours ago

GBPUSD Wave Analysis 24 September 2024

- GBPUSD broke resistance area - Likely to rise to resistance level 1.3500 GBPUSD recently…

23 hours ago

Services sector underpins US economy amid manufacturing slowdown

The US manufacturing PMI fell to 47.0 in September. The services sector remains a solid…

1 day ago

This website uses cookies