Categories: Technical analysis

CADJPY Wave Analysis – 23 April 2025

CADJPY: ⬆️ Buy

– CADJPY reversed from strong support area

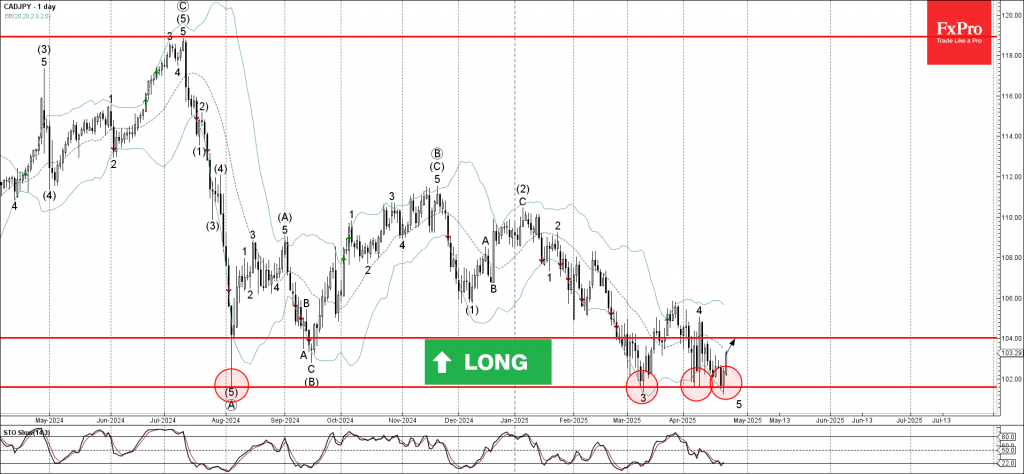
– Likely to rise to resistance level 104.00

CADJPY currency pair recently reversed from the strong support area between the long-term support level 101.60 (which stopped the sharp downtrend in August of 2024) and the lower daily Bollinger Band.

The upward reversal from this support area created the daily Japanese candlesticks reversal pattern Piercing Line. 

Given the strength of the support level 101.60 and the bullish Canadian dollar sentiment seen today, CADJPY currency pair can be expected to rise toward the next resistance level 104.00.

The FxPro Tech Analysis Team

The FxPro technical experts prepare a daily analysis of the most active currency pairs (majors, crosses, exotics) and commodities. Selected instruments are reviewed on daily trends (D1, H4), using the active Elliott Wave setups, Japanese candlesticks, indicators, and support/resistance levels.

Share
Published by
The FxPro Tech Analysis Team
Tags: CADJPY

Recent Posts

Pro News Weekly: Dollar Rebounds as Markets Test New Limits

Welcome to Pro News Weekly! Here’s what is shaping the markets: 💵 The U.S. dollar…

3 hours ago

Geopolitics will destroy the euro

•    EURUSD falls due to geopolitics and expectations of tariff removal •    Gold returns to…

11 hours ago

Platinum Wave Analysis – 8 January 2026

Platinum: ⬇️ Sell - Platinum reversed from pivotal resistance level 150.00 - Likely to fall to…

24 hours ago

Baidu Wave Analysis – 8 January 2026

Baidu: ⬇️ Sell - Baidu reversed from resistance zone - Likely to fall to support level…

24 hours ago

EURUSD Wave Analysis – 8 January 2026

EURUSD: ⬇️ Sell - EURUSD broke daily up channel - Likely to fall to support…

1 day ago

WTI crude oil Wave Analysis – 8 January 2026

WTI crude oil: ⬆️ Buy - WTI crude oil reversed from support zone - Likely…

1 day ago

This website uses cookies