Categories: Technical analysis

CADJPY Wave Analysis 20 November 2023

– CADJPY reversed from the long-term resistance level 110.30

– Likely to fall to support level 107.50

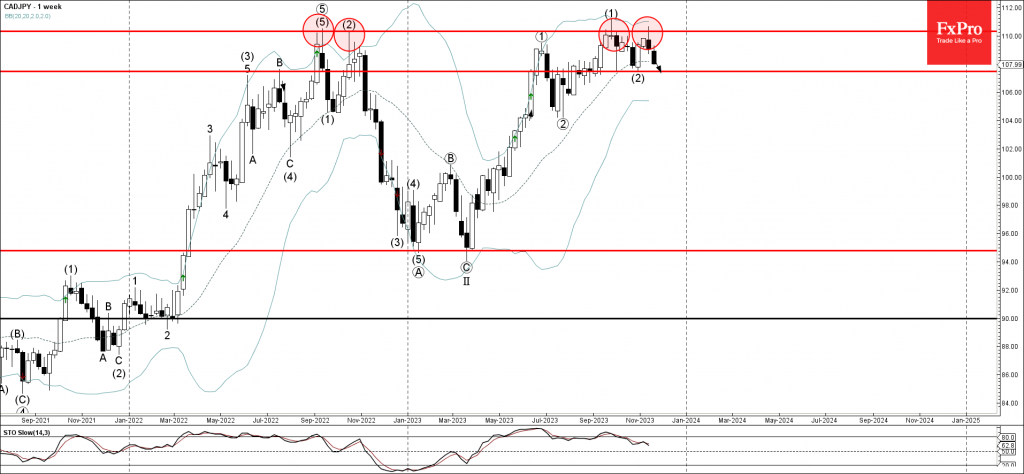
CADJPY currency pair recently reversed down from the long-term resistance level 110.30 (former yearly high, Double Top from last year) strengthened by the upper weekly Bollinger Band.

The downward reversal from the resistance level 110.30 stopped the previous medium-term impulse wave (3).

Given the strength of the resistance level 110.30 and the strongly bearish CAD sentiment seen across the FX markets today, CADJPY currency pair can be expected to fall toward the next support level 107.50 (low of the previous correction (2)).

The FxPro Tech Analysis Team

The FxPro technical experts prepare a daily analysis of the most active currency pairs (majors, crosses, exotics) and commodities. Selected instruments are reviewed on daily trends (D1, H4), using the active Elliott Wave setups, Japanese candlesticks, indicators, and support/resistance levels.

Share
Published by
The FxPro Tech Analysis Team
Tags: CADJPY

Recent Posts

EURCAD Wave Analysis 6 September 2024

- EURCAD reversed from pivotal support level 1.4900 - Likely to rise to resistance level…

2 days ago

EURUSD Wave Analysis 6 September 2024

- EURUSD reversed from support level 1.1030 - Likely to rise to resistance level 1.1200…

2 days ago

Further Unwinding of Carry Trade

The unwinding of the carry trade in the FX market continues, with the major safe…

2 days ago

Bitcoin pressured by risk-off mood

Market Picture The pressure on risk assets continues, pushing the crypto market capitalisation back below…

2 days ago

AUDUSD Wave Analysis 5 September 2024

- AUDUSD reversed from support level 0.6700 - Likely to rise to resistance level 0.6800…

2 days ago

Gold Wave Analysis 5 September 2024

- Gold reversed from support level 2475.00 - Likely to rise to resistance level 2535.00…

2 days ago

This website uses cookies