Categories: Technical analysis

CADJPY Wave Analysis 16 December, 2020

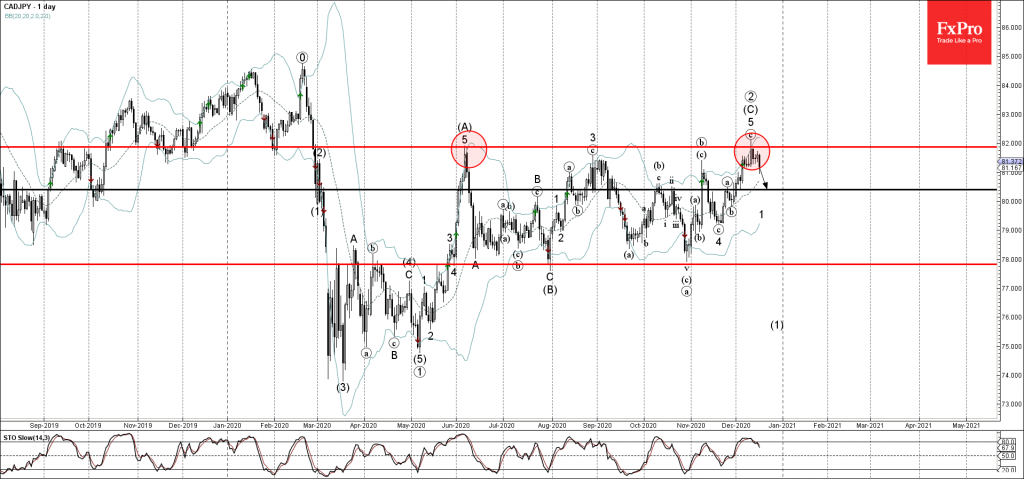
• CADJPY reversed from key resistance level 82.00

• Likely to fall to 80.40

CADJPY previously reversed down from the key resistance level 82.00 (which also reversed the price at the start of May as can be seen from the daily CADJPY chart below).

The downward reversal from the resistance level 82.00 started the active downward impulse waves 1 and (1).

CADJPY is expected to fall further toward the next support level 80.40 (former resistance from the end of November).

The FxPro Tech Analysis Team

The FxPro technical experts prepare a daily analysis of the most active currency pairs (majors, crosses, exotics) and commodities. Selected instruments are reviewed on daily trends (D1, H4), using the active Elliott Wave setups, Japanese candlesticks, indicators, and support/resistance levels.

Share
Published by
The FxPro Tech Analysis Team
Tags: CADJPY

Recent Posts

Platinum Wave Analysis – 8 January 2026

Platinum: ⬇️ Sell - Platinum reversed from pivotal resistance level 150.00 - Likely to fall to…

6 hours ago

Baidu Wave Analysis – 8 January 2026

Baidu: ⬇️ Sell - Baidu reversed from resistance zone - Likely to fall to support level…

6 hours ago

EURUSD Wave Analysis – 8 January 2026

EURUSD: ⬇️ Sell - EURUSD broke daily up channel - Likely to fall to support…

7 hours ago

WTI crude oil Wave Analysis – 8 January 2026

WTI crude oil: ⬆️ Buy - WTI crude oil reversed from support zone - Likely…

7 hours ago

Do not underestimate dollar

Positive macro statistics for the US are helping the greenback. Gold could rise to $4,610…

14 hours ago

Crypto fails to find support for a breakout

Crypto markets fell amid caution; Bitcoin and Ethereum face technical and investor shifts, with privacy…

15 hours ago

This website uses cookies