Categories: Technical analysis

CADJPY Wave Analysis 12 March, 2021

• CADJPY broke resistance level 86.90

• Likely to test resistance level 88.00

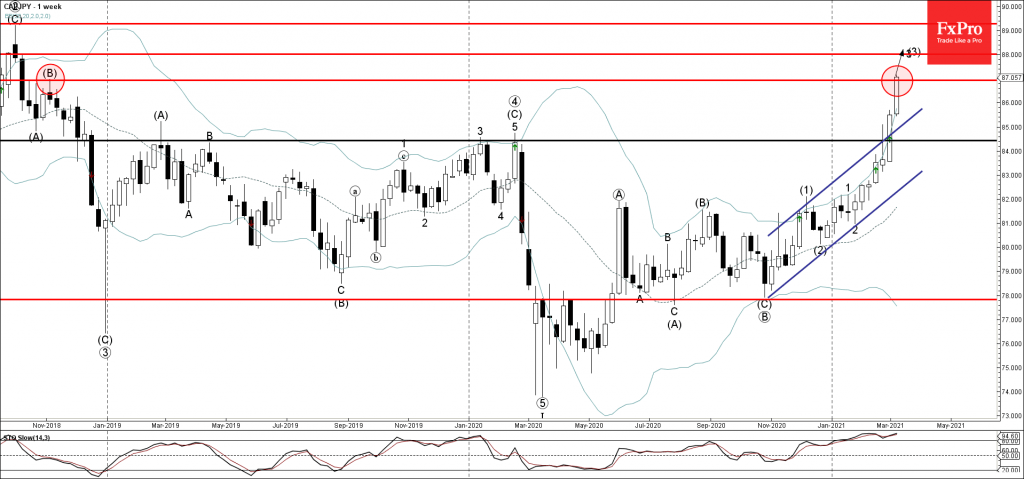
CADJPY recently broke the resistance level 86.90 (former top of the weekly correction (B) from the end of 2018 as can be seen from the weekly CADJPY chart below).

The breakout of the resistance level 86.90 should be followed with the weekly close above this level for the price to continue to rise further.

If the pair closes above the resistance level 86.90 on the weekly basis – CADJPY can then rise toward the next resistance level 88.00 (target price for the competition of the active impulse wave (3)).

The FxPro Tech Analysis Team

The FxPro technical experts prepare a daily analysis of the most active currency pairs (majors, crosses, exotics) and commodities. Selected instruments are reviewed on daily trends (D1, H4), using the active Elliott Wave setups, Japanese candlesticks, indicators, and support/resistance levels.

Share
Published by
The FxPro Tech Analysis Team
Tags: CADJPY

Recent Posts

Crypto Market Tries to Break Local Downtrend 

Market picture  Crypto market capitalisation has been up 2% over the past seven days and…

3 hours ago

Adobe Wave Analysis 3 May 2024

- Adobe reversed from support zone - Likely to rise to resistance level 500.00 Adobe…

3 days ago

EURGBP Wave Analysis 3 May 2024

- EURJPY reversed from support zone - Likely to rise to resistance level 0.8625 EURGBP…

3 days ago

How Low Can the USDJPY Go?

USDJPY was slipping below 153 on Friday morning, a three-week low and having lost over…

3 days ago

Bitcoin’s Downtrend, Solana and Ethereum Form Double Bottom

Market picture  Crypto market capitalisation rose 3.3% in 24 hours to $2.22 trillion. Local capitalisation…

3 days ago

EURJPY Wave Analysis 2 May 2024

- EURJPY under strong bearish pressure - Likely to fall to support level 163.10 EURJPY…

4 days ago

This website uses cookies