Categories: Technical analysis

CADJPY Wave Analysis – 11 March 2025

CADJPY: ⬆️ Buy

– CADJPY reversed from the support area

– Likely to rise to the resistance level 104.00

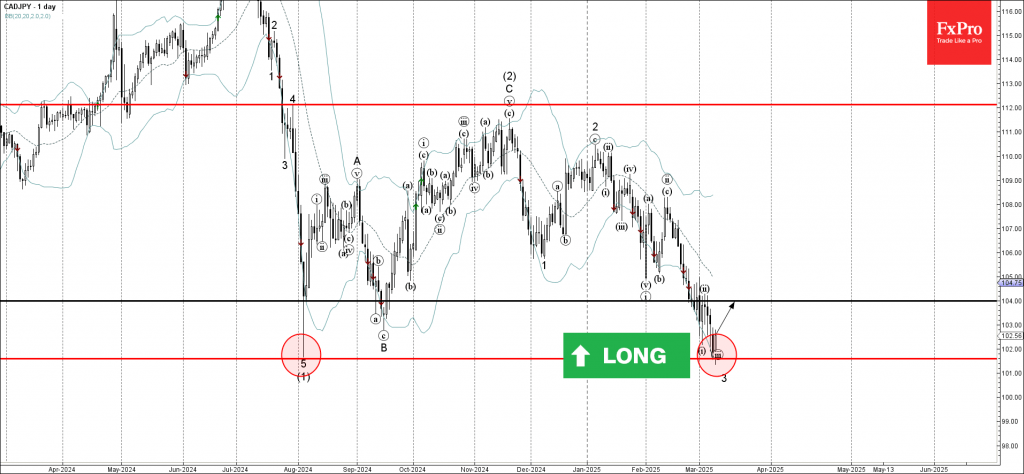
CADJPY currency pair recently reversed up from the support area between the major long-term support level 101.60 (former multi-month support from August) and the lower daily Bollinger Band.

The upward reversal from this support area will likely form the daily Japanese candlesticks reversal pattern Bullish Engulfing.

Given the strength of the support level 101.60, CADJPY currency pair can be expected to rise to the next resistance level 104.00 (former top of wave ii).

AddThis Website Tools
The FxPro Tech Analysis Team

The FxPro technical experts prepare a daily analysis of the most active currency pairs (majors, crosses, exotics) and commodities. Selected instruments are reviewed on daily trends (D1, H4), using the active Elliott Wave setups, Japanese candlesticks, indicators, and support/resistance levels.

Share
Published by
The FxPro Tech Analysis Team
Tags: CADJPY

Recent Posts

Bitcoin Wave Analysis – 22 April 2025

Bitcoin: ⬆️ Buy - Bitcoin broke round resistance level 90000.00 - Likely to rise to…

10 hours ago

AUDUSD Wave Analysis – 22 April 2025

AUDUSD: ⬇️ Sell - AUDUSD reversed from the key resistance level 0.6400 - Likely to…

10 hours ago

Crypto Market Escapes from Fear

Market Overview The crypto market has gained around 2% over the past seven days, with…

23 hours ago

Nike Wave Analysis – 21 April 2025

Nike: ⬆️ Buy - Nike reversed from the long-term support level 52.60 - Likely to…

1 day ago

Natural Gas Wave Analysis – 21 April 2025

Natural gas: ⬇️ Sell Natural gas broke support area Likely to fall to support level…

1 day ago

EURUSD Wave Analysis – 21 April 2025

EURUSD: ⬆️ Buy - EURUSD broke the resistance area - Likely to test resistance level…

2 days ago