Categories: Technical analysis

CADJPY Wave Analysis – 04 March, 2020

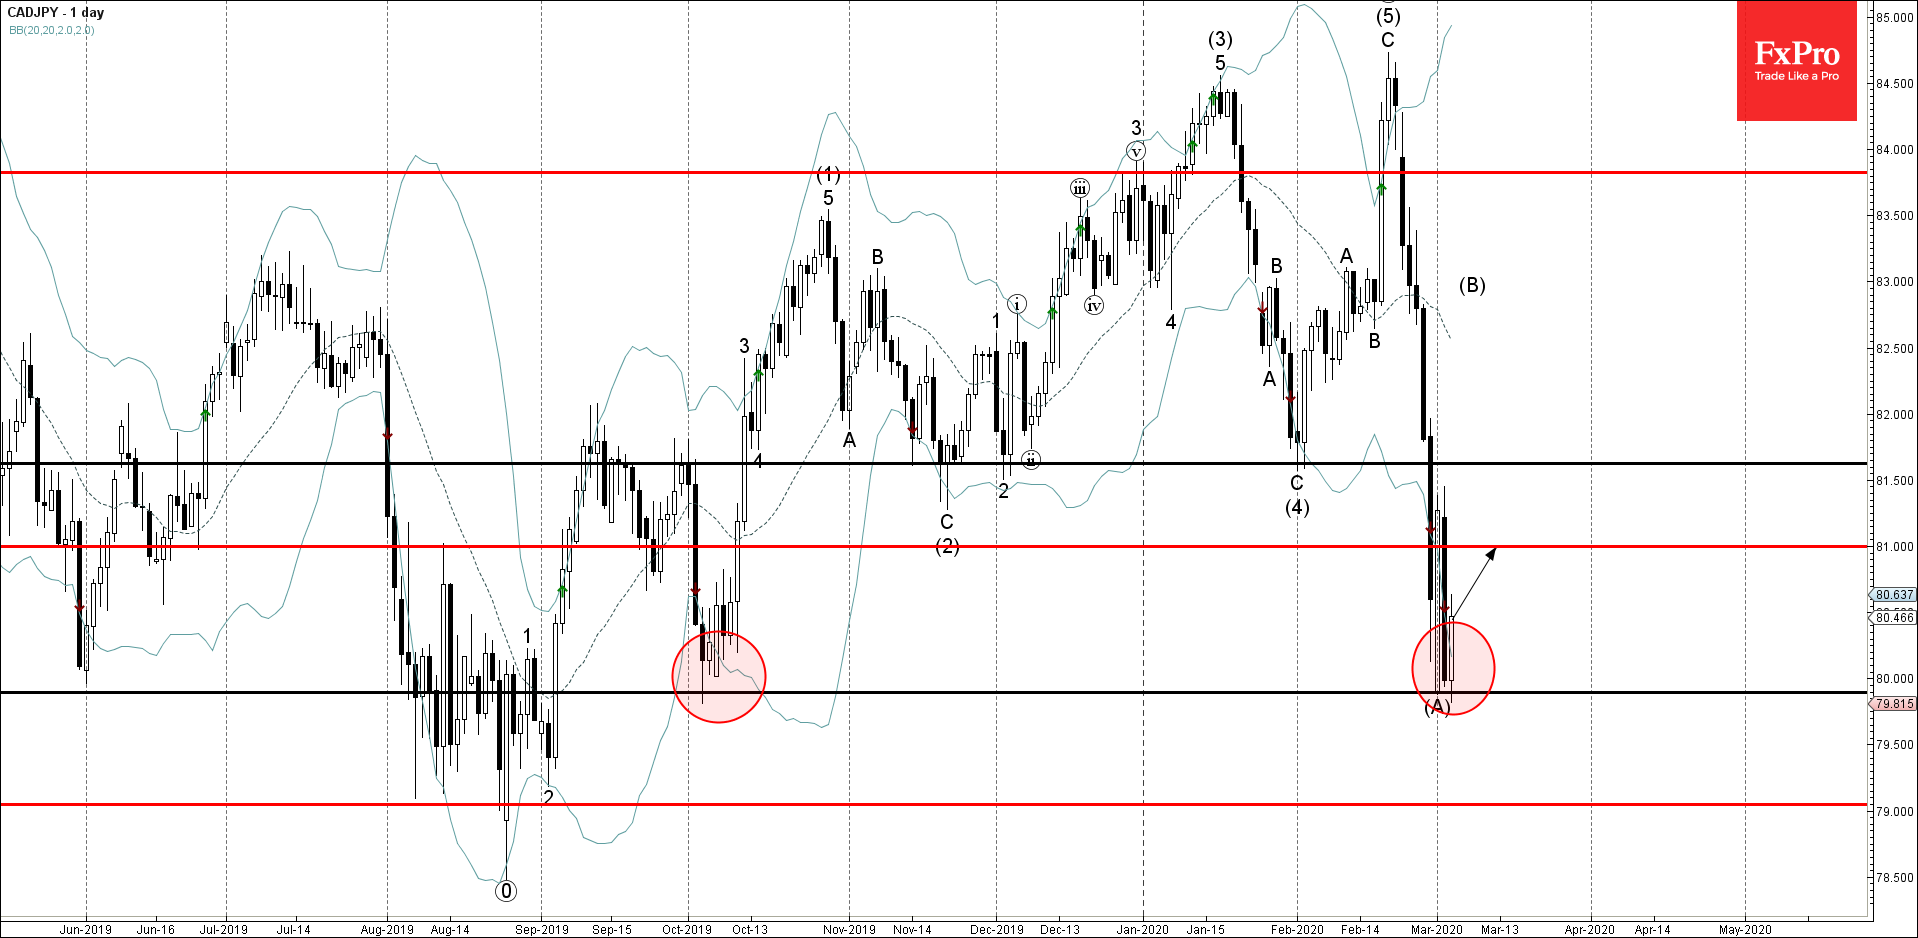
  • CADJPY reversed from support zone
  • Likely to rise to 81.00

CADJPY recently reversed up from the support zone lying between the round support level 80.00 (monthly low from last October) and the lower daily Bollinger Band.

The upward reversal from this support zone started the active short-term corrective wave (B).

CADJPY is likely to rise further in the active correction (B) toward the next resistance level 81.00 – the breakout of which can lead to further gains toward 81.60 (former monthly low from January).

The FxPro Tech Analysis Team

The FxPro technical experts prepare a daily analysis of the most active currency pairs (majors, crosses, exotics) and commodities. Selected instruments are reviewed on daily trends (D1, H4), using the active Elliott Wave setups, Japanese candlesticks, indicators, and support/resistance levels.

Share
Published by
The FxPro Tech Analysis Team
Tags: CADJPY

Recent Posts

Matured altcoins are losing strength

Market Picture Neither the meme mania in equities, the overall positivity in stock indices, nor…

2 hours ago

EURCHF Wave Analysis – 14 May, 2024

• EURCHF rising inside impulse wave 3 • Likely to reach resistance level 0.9835 EURCHF…

18 hours ago

Goldman Sachs Wave Analysis – 14 May, 2024

• Goldman Sachs broke the key resistance level 430.00 • Likely to rise to resistance…

18 hours ago

⚡️Calling all EV Stock Sharks⚡️

Zeekr, China's Tesla rival, recently had its IPO, and now you can trade it at…

20 hours ago

Oil is retreating but unlikely to repeat the collapses of 2020, 2014 or 2008

Crude oil has been under pressure over the past four weeks but has been gaining…

21 hours ago

Ethereum knocking at support’s door

Market picture Crypto market capitalisation rose 0.8% over the past 24 hours to 2.2 trillion,…

1 day ago

This website uses cookies