Categories: Technical analysis

CADJPY Analysis 09 November, 2020

• CADJPY broke resistance area

• Likely to rise to 81.65

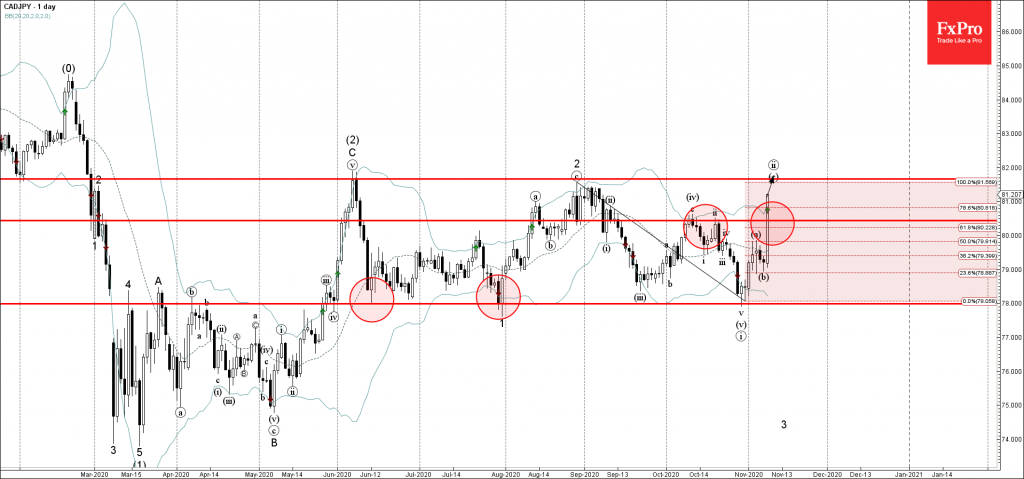
CADJPY today broke sharply above the resistance area located between the resistance level 80.50 (which reversed the price twice in October) and the 61.8 % Fibonacci correction of the previous downward impulse from August.

The breakout of this resistance area accelerated the (c)-wave of the active minor ABC correction (ii) from the end of October.

CADJPY is likely to rise further toward the next resistance level 81.65 (top of the previous waves (2) and 2 and the target for the completion of the active ABC correction (ii)).

The FxPro Tech Analysis Team

The FxPro technical experts prepare a daily analysis of the most active currency pairs (majors, crosses, exotics) and commodities. Selected instruments are reviewed on daily trends (D1, H4), using the active Elliott Wave setups, Japanese candlesticks, indicators, and support/resistance levels.

Share
Published by
The FxPro Tech Analysis Team
Tags: CADJPY

Recent Posts

Oil Bounces Locally, Global Support 5% below Spot Price 

The number of operating oil rigs in the US fell by 7 to 499. This…

2 hours ago

Crypto Market Tries to Break Local Downtrend

Market picture  Crypto market capitalisation has been up 2% over the past seven days and…

9 hours ago

Adobe Wave Analysis 3 May 2024

- Adobe reversed from support zone - Likely to rise to resistance level 500.00 Adobe…

3 days ago

EURGBP Wave Analysis 3 May 2024

- EURGBP reversed from support zone - Likely to rise to resistance level 0.8625 EURGBP…

3 days ago

How Low Can the USDJPY Go?

USDJPY was slipping below 153 on Friday morning, a three-week low and having lost over…

3 days ago

Bitcoin’s Downtrend, Solana and Ethereum Form Double Bottom

Market picture  Crypto market capitalisation rose 3.3% in 24 hours to $2.22 trillion. Local capitalisation…

3 days ago

This website uses cookies