Categories: Technical analysis

CADCHF Wave Analysis 7 September 2023

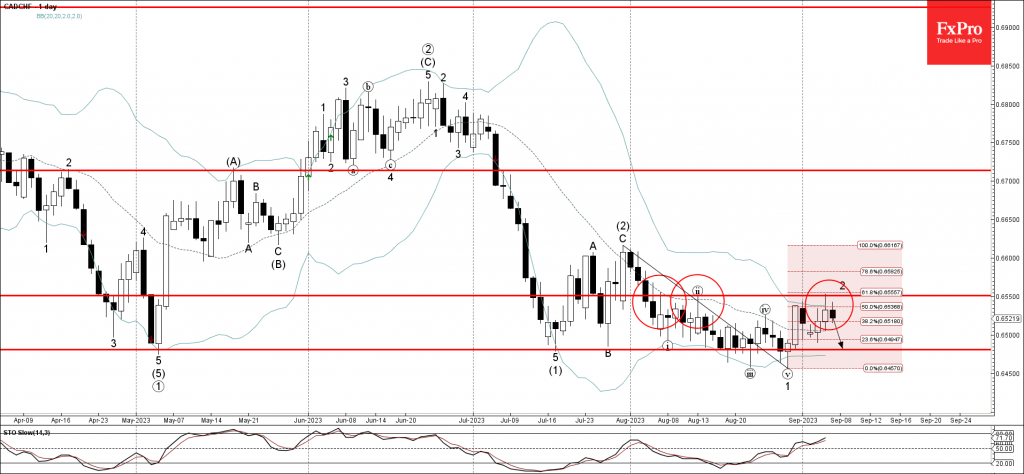
– CADCHF reversed from resistance level 0.6550

– Likely to fall to support level 0.6480

CADCHF currency pair recently reversed down from the pivotal resistance level 0.6550 (which has been repeatedly reversing the pair from the start of August), intersecting with the upper daily Bollinger Band and the 61.8% Fibonacci correction of the downward impulse from July.

The downward reversal from the resistance level 0.6550 stopped the previous short-term correction 2.

Given the strong daily downtrend, CADCHF can be expected to fall toward the next support level 0.6480 (which has been reversing the price from May).

The FxPro Tech Analysis Team

The FxPro technical experts prepare a daily analysis of the most active currency pairs (majors, crosses, exotics) and commodities. Selected instruments are reviewed on daily trends (D1, H4), using the active Elliott Wave setups, Japanese candlesticks, indicators, and support/resistance levels.

Share
Published by
The FxPro Tech Analysis Team
Tags: CADCHF

Recent Posts

Bitcoin Cash Wave Analysis – 12 January 2026

Bitcoin Cash: ⬇️ Sell - Bitcoin Cash reversed from resistance area - Likely to fall…

14 minutes ago

EURJPY Wave Analysis – 12 January 2026

EURJPY: ⬆️ Buy - EURJPY reversed from support area - Likely to rise to resistance…

15 minutes ago

Gold shines on an anti-fiat thesis

The dollar suffered due to threats to the Fed’s independence. Gold managed to renew its…

10 hours ago

SP500 Current situation #trading #tradelikeapro #sp500 #tradingshorts #tradingstrategy

Today is Monday, the 12th of January, and once again we will talk about the…

10 hours ago

Crypto: sell-the-growth continues

Crypto markets remain volatile; Bitcoin faces selling pressure, XRP slips, Monero surges, and market signals…

12 hours ago

CHFJPY Wave Analysis – 9 January 2026

CHFJPY: ⬆️ Buy - CHFJPY reversed from support area - Likely to rise to resistance…

3 days ago

This website uses cookies