Categories: Technical analysis

CADCHF Wave Analysis – 31 December, 2019

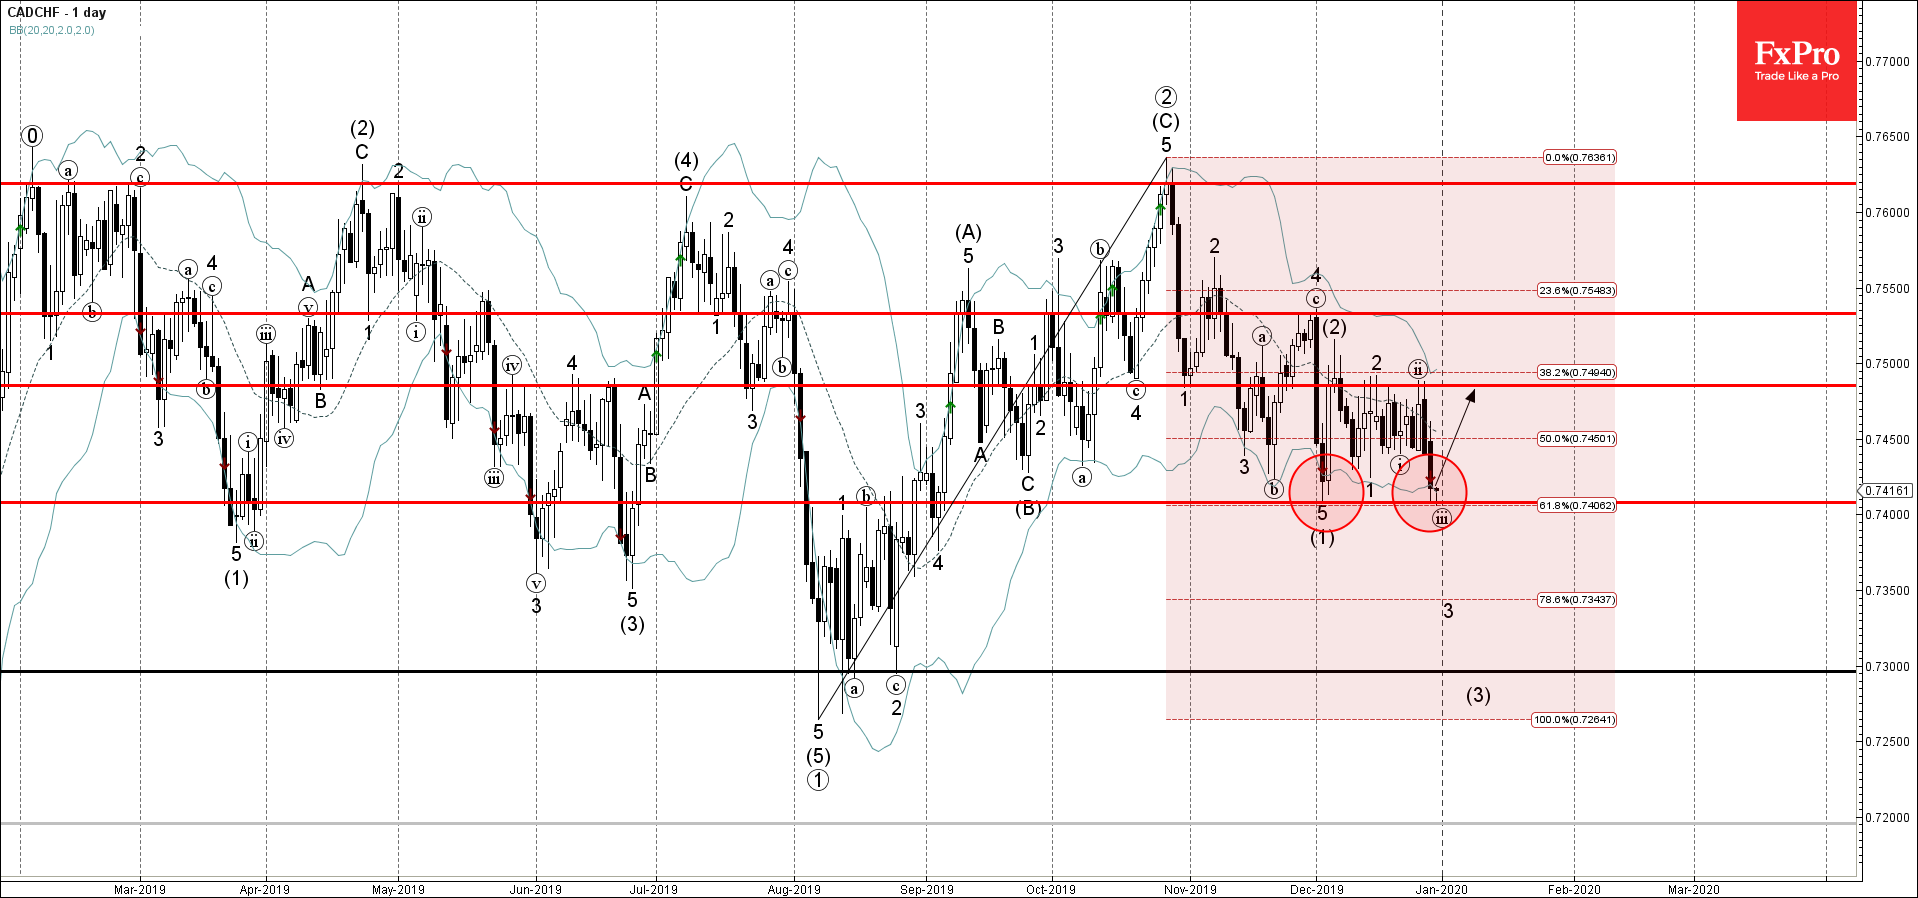
  • CADCHF approached support area
  • Likely to rise to 0.7485

CADCHF is currently trading close to the key support area lying between the support level 0.7400 (which stopped the previous impulse wave (1)), lower daily Bollinger Band and the 61.8% Fibonacci correction of the previous ABC correction from August to November.

The price earlier reversed up sharply from the support level 0.7400 – signalling the strength of this price level.

CADCHF is likely to correct up from the current levels toward the next resistance level 0.7485 (top of the previous waves 2 and (ii)).

The FxPro Tech Analysis Team

The FxPro technical experts prepare a daily analysis of the most active currency pairs (majors, crosses, exotics) and commodities. Selected instruments are reviewed on daily trends (D1, H4), using the active Elliott Wave setups, Japanese candlesticks, indicators, and support/resistance levels.

Share
Published by
The FxPro Tech Analysis Team
Tags: CADCHF

Recent Posts

Nikkei 225 Wave Analysis – 4 April 2025

Nikkei 225: ⬇️ Sell - Nikkei 225 broke support zone - Likely to fall to…

2 days ago

Gold Wave Analysis – 4 April 2025

Gold: ⬇️ Sell - Gold broke daily up channel - Likely to fall to support…

2 days ago

Video Pro News Weekly

The U.S. dollar takes a major hit as trade tariffs spark capital flight, while global…

3 days ago

Mad Gold and Crude Oil

Gold experienced a significant increase followed by a sharp decline. It may be a good…

3 days ago

The US index’s demise has accelerated after confirming the downtrend

US indices fell after tough tariffs were announced by Trump, triggering a negative reaction in…

3 days ago

Tariff wars made the dollar a risky asset

The US dollar is experiencing a decline due to trade tariffs and capital flight. The…

3 days ago

This website uses cookies