Categories: Technical analysis

CADCHF Wave Analysis – 3 March, 2022

• CADCHF reversed from resistance level 0.7300
• Likely to fall to support level 0.7250.

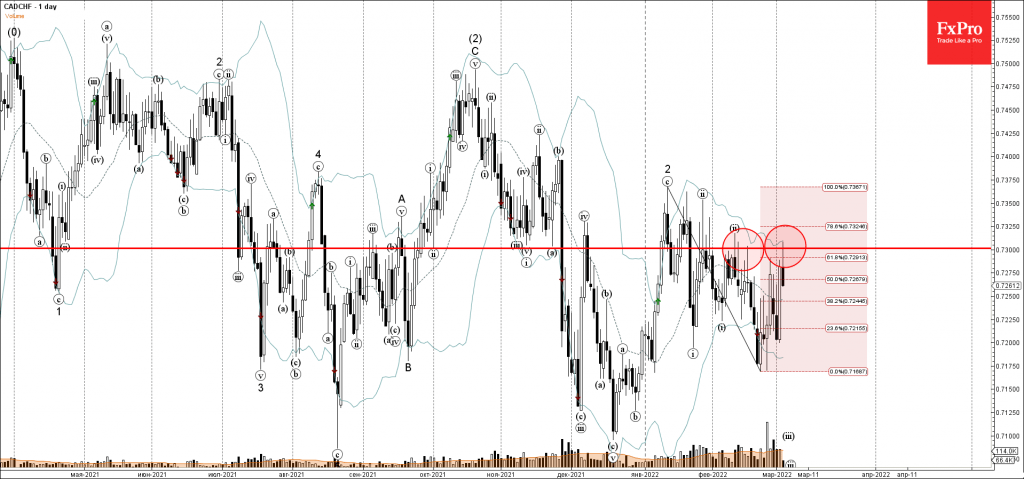
CADCHF currency pair recently reversed down from the pivotal resistance level 0.7300 (which has been reversing the pair from the start of February).

The resistance zone near the resistance level 0.7300 was strengthened by the upper daily Bollinger Band and by the 61.8% Fibonacci correction of the previous downward impulse from the start of January.

Given the CAD outflows (on oil losses) – CADCHF can be expected to fall further toward the next support level 0.7250.

The FxPro Tech Analysis Team

The FxPro technical experts prepare a daily analysis of the most active currency pairs (majors, crosses, exotics) and commodities. Selected instruments are reviewed on daily trends (D1, H4), using the active Elliott Wave setups, Japanese candlesticks, indicators, and support/resistance levels.

Share
Published by
The FxPro Tech Analysis Team
Tags: CADCHF

Recent Posts

CHFJPY Wave Analysis – 9 January 2026

CHFJPY: ⬆️ Buy - CHFJPY reversed from support area - Likely to rise to resistance…

2 days ago

Exxon Mobil Wave Analysis – 9 January 2026

Exxon Mobil: ⬆️ Buy - Exxon Mobil reversed from support area - Likely to rise…

2 days ago

Pro News Weekly: Dollar Rebounds as Markets Test New Limits

Welcome to Pro News Weekly! Here’s what is shaping the markets: 💵 The U.S. dollar…

2 days ago

Geopolitics will destroy the euro

•    EURUSD falls due to geopolitics and expectations of tariff removal •    Gold returns to…

2 days ago

Platinum Wave Analysis – 8 January 2026

Platinum: ⬇️ Sell - Platinum reversed from pivotal resistance level 150.00 - Likely to fall to…

3 days ago

Baidu Wave Analysis – 8 January 2026

Baidu: ⬇️ Sell - Baidu reversed from resistance zone - Likely to fall to support level…

3 days ago

This website uses cookies