Categories: Technical analysis

CADCHF Wave Analysis – 27 August, 2019

  • CADCHF broke resistance area
  • Further gains are likely

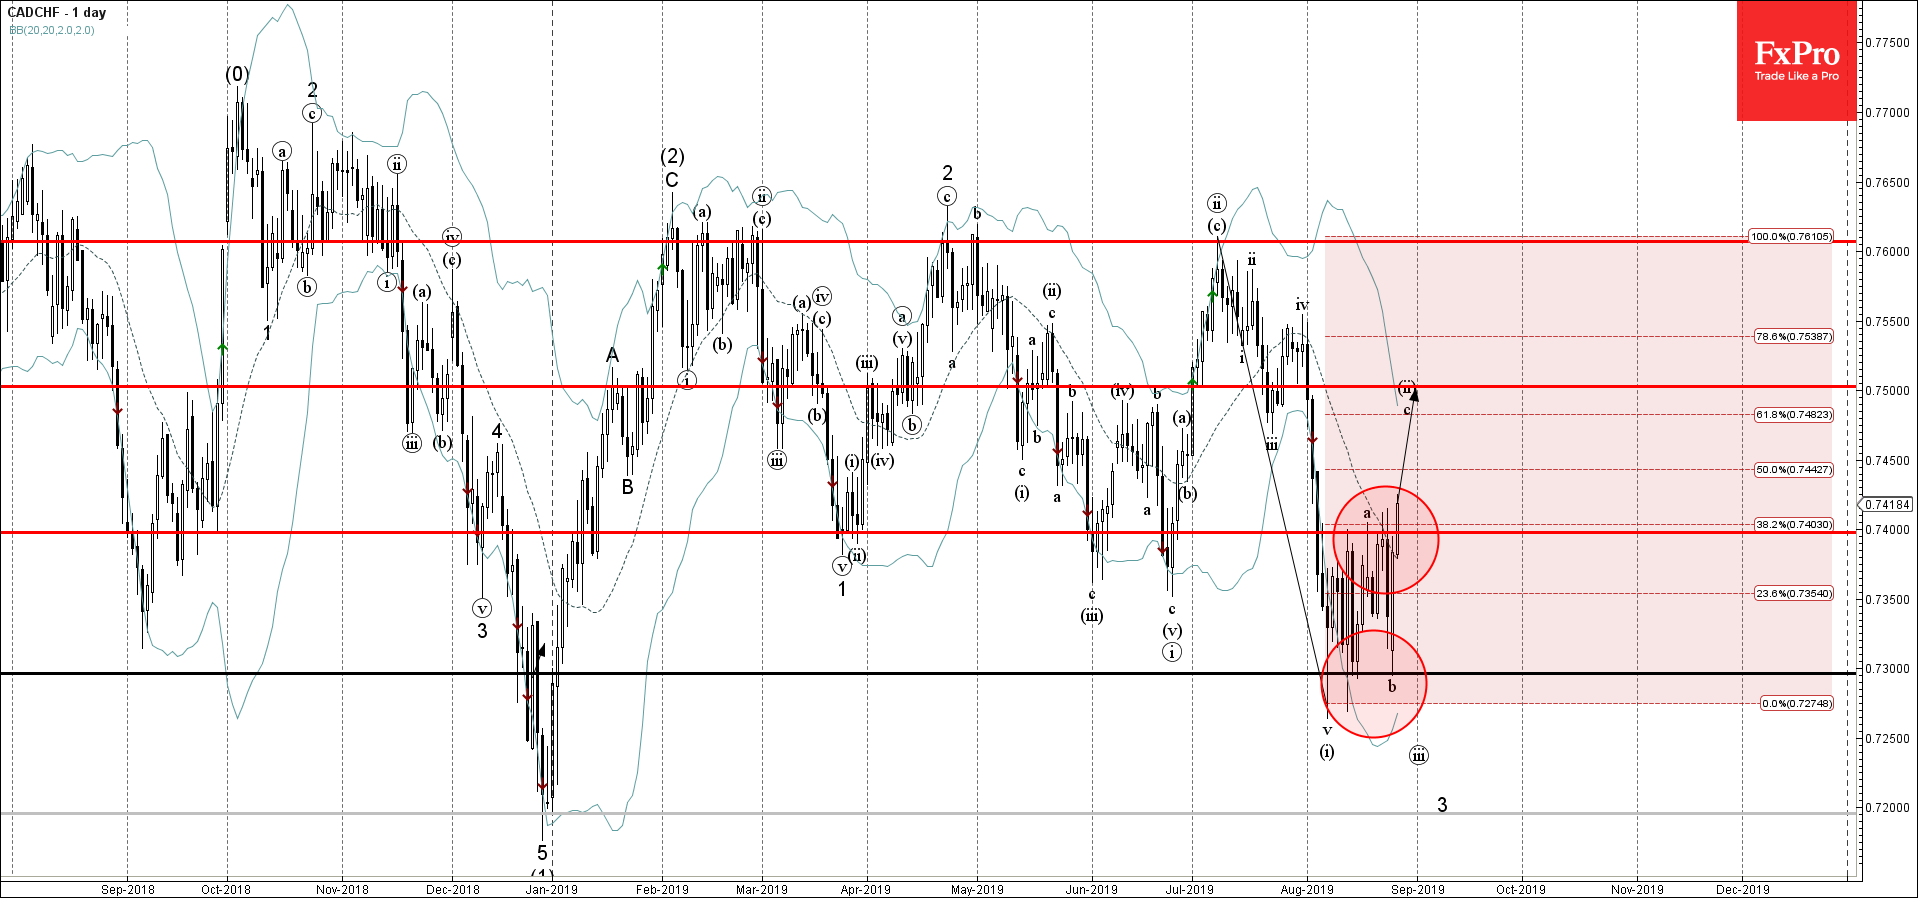
CADCHF recently broke the resistance zone lying between the resistance level 0.7400 (former support from March) and the 38.2% Fibonacci correction of the previous downward impulse from July.

The breakout of this resistance area accelerated the active short-term ABC correction (ii).

CADCHF is expected to rise further and retest the next resistance level 0.7500 (target price for the completion of the active wave (ii)).

The FxPro Tech Analysis Team

The FxPro technical experts prepare a daily analysis of the most active currency pairs (majors, crosses, exotics) and commodities. Selected instruments are reviewed on daily trends (D1, H4), using the active Elliott Wave setups, Japanese candlesticks, indicators, and support/resistance levels.

Share
Published by
The FxPro Tech Analysis Team
Tags: CADCHF

Recent Posts

Another Dip in Crypto Capitalization 

Market picture  The crypto market capitalisation decreased by another 1.5% to $2.27 trillion, getting closer…

3 hours ago

ANF Wave Analysis 29 April 2024

ANF reversed from key support level 113.40 Likely to rise to resistance level 132.31 ANF…

19 hours ago

GBPUSD Wave Analysis 29 April 2024

- GBPUSD rising inside minor correction 2 - Likely to rise to resistance level 1.2700…

19 hours ago

Crypto Market Retreats Due to Overhang of Sellers

Market picture The crypto market has lost 3.3% in the last 24 hours to $2.3…

1 day ago

USDJPY Wave Analysis 26 April 2024

- USDJPY broke key resistance level 155.00 - Likely to rise to resistance level 160.00…

4 days ago

Ebay Wave Analysis 26 April 2024

- Ebay reversed from support level 49.35 - Likely to rise to resistance level 52.55…

4 days ago

This website uses cookies