Categories: Technical analysis

CADCHF Wave Analysis – 24 February, 2020

  • CADCHF falling inside wave (ii)
  • Likely to fall to 0.7350

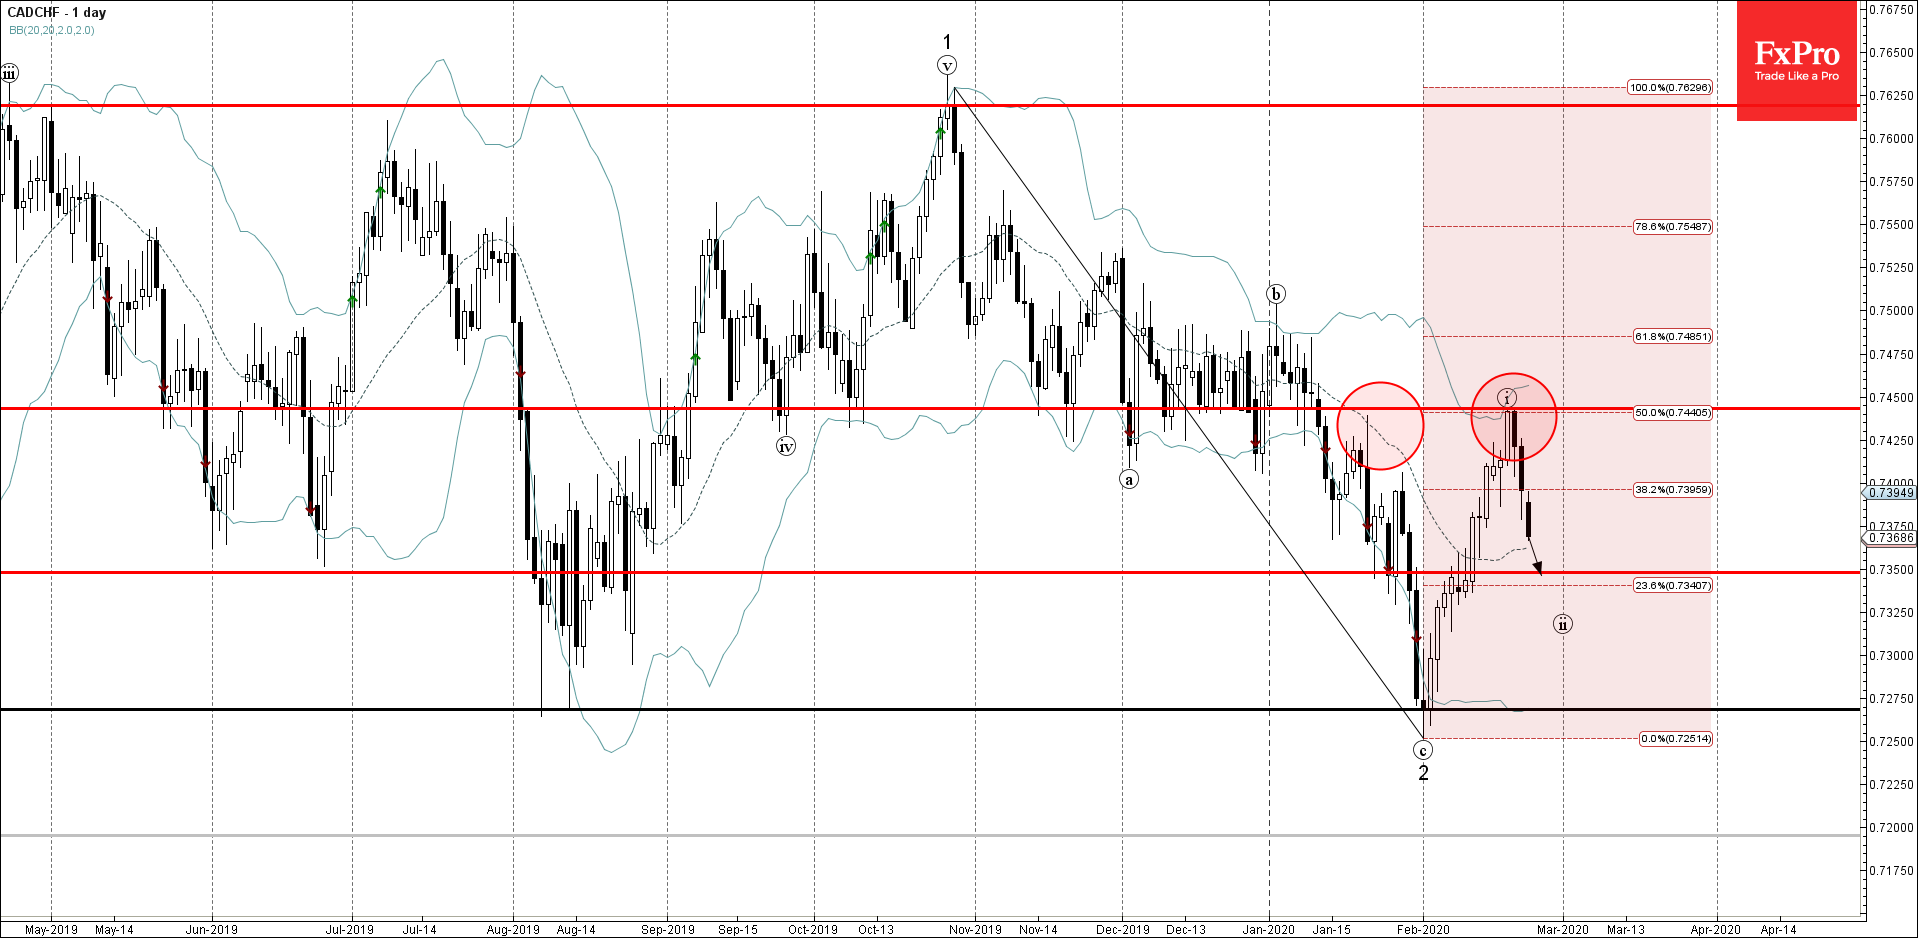
CADCHF recently reversed down with the daily Dark Cloud Cover from the resistance area lying between the key resistance level 0.7440 (top of the previous correction from January), upper daily Bollinger Band and the 50% Fibonacci correction of the previous downward impulse from October.

The downward reversal from this resistance area started active short-term corrective wave (ii).

Given the prevailing bearish sentiment affecting Canadian dollar – CADCHF is likely to fall further toward the next support level 0.7350.

The FxPro Tech Analysis Team

The FxPro technical experts prepare a daily analysis of the most active currency pairs (majors, crosses, exotics) and commodities. Selected instruments are reviewed on daily trends (D1, H4), using the active Elliott Wave setups, Japanese candlesticks, indicators, and support/resistance levels.

Share
Published by
The FxPro Tech Analysis Team
Tags: CADCHF

Recent Posts

Brent Crude oil Wave Analysis – 13 January 2026

Brent Crude oil ⬆️ Buy - Brent Crude oil rising inside impulse wave c -…

7 hours ago

USDJPY Wave Analysis – 13 January 2026

USDJPY ⬆️ Buy - USDJPY broke resistance area - Likely to rise to resistance level…

7 hours ago

Exxon Mobil Wave Analysis – 13 January 2026

Exxon Mobil ⬆️ Buy - Exxon Mobil broke resistance level 125.60 - Likely to rise…

7 hours ago

BNB Wave Analysis – 13 January 2026

Brent Crude oil ⬆️ Buy - BNB broke out of sideways price range - Likely…

7 hours ago

A slightly weaker CPI was not enough to break through the highs

US CPI data a bit softer than forecasts, sparking brief market optimism, but resistance remains.…

13 hours ago

Pro News Flash: Global Tensions Fuel a Fresh Oil Rally

🛢️ Oil prices are finding fresh strength as geopolitical tensions in the Middle East reignite…

13 hours ago

This website uses cookies