Categories: Technical analysis

CADCHF Wave Analysis – 22 November, 2021

• CADCHF reversed from support area

• Likely to rise to resistance level 0.7415                                                                  


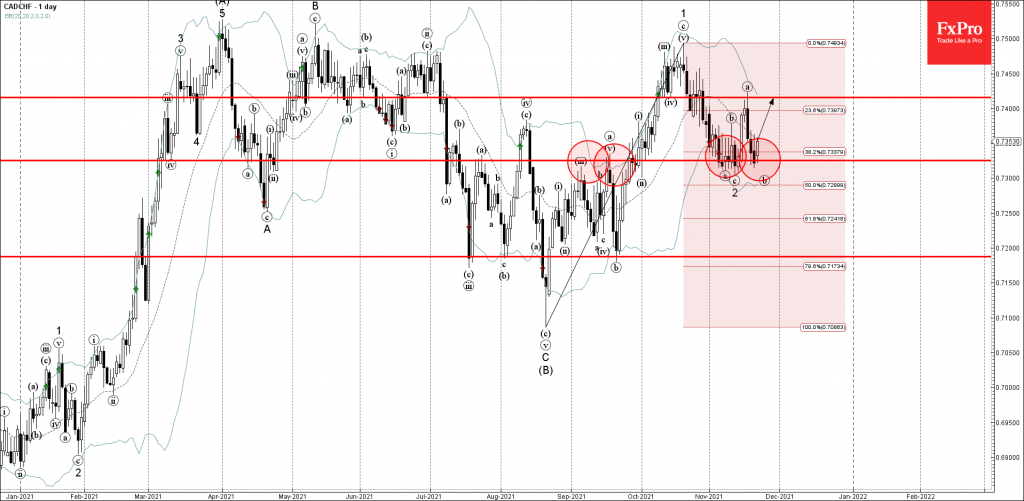
CADCHF recently reversed up from the support area located between the key support level 0.7325 (which has been repeatedly reversing the price from the start of November), lower daily Bollinger Band and the 38.2% Fibonacci correction of the upward price impulse 1 from the middle of August.

The upward reversal from this support area stopped the earlier minor corrective wave (b).

Given the strength of the support level 0.7325, CADCHF can be expected to rise further toward the next resistance level 0.7415 (top of wave (a)).

The FxPro Tech Analysis Team

The FxPro technical experts prepare a daily analysis of the most active currency pairs (majors, crosses, exotics) and commodities. Selected instruments are reviewed on daily trends (D1, H4), using the active Elliott Wave setups, Japanese candlesticks, indicators, and support/resistance levels.

Share
Published by
The FxPro Tech Analysis Team
Tags: CADCHF

Recent Posts

Baidu Wave Analysis – 11 April 2025

Baidu: ⬆️ Buy - Baidu reversed from support zone - Likely to rise to resistance level…

2 days ago

USDCAD Wave Analysis – 11 April 2025

USDCAD: ⬇️ Sell - USDCAD broke support zone - Likely to fall to support level…

2 days ago

Video: Massive Market Reversal or Total Collapse? The Charts Are Screaming…

We break down one of the most dramatic weeks in the markets — including a…

3 days ago

US Dollar Suffers Amidst Inflation Data and Expectations

The US dollar is suffering due to weaker than expected inflation data and a surge…

3 days ago

USDJPY Wave Analysis – 11 April 2025

USDJPY: ⬇️ Sell - USDJPY broke the support zone - Likely to fall to support…

3 days ago

Bitcoin Wave Analysis – 11 April 2025

Bitcoin: ⬆️ Buy - Bitcoin reversed from support zone - Likely to rise to resistance…

3 days ago

This website uses cookies