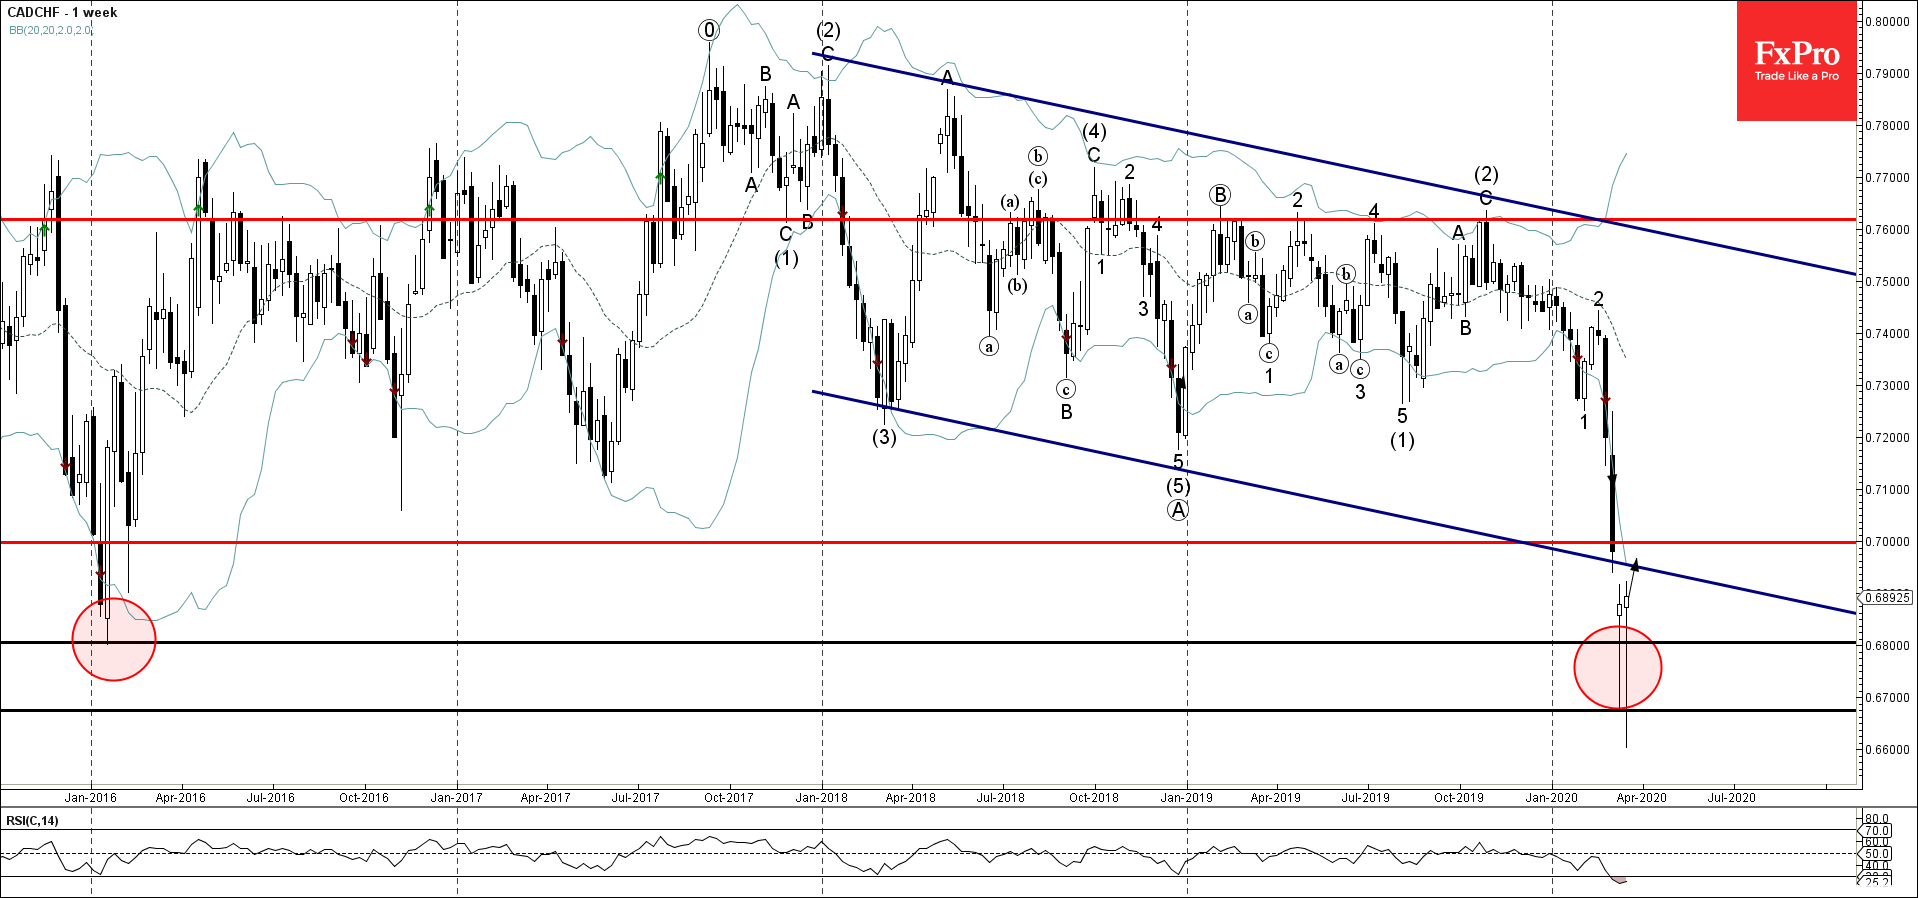
- CADCHF forming second weekly Hammer
- Likely to rise to 0.7000
CADCHF is in the process of forming the second consecutive weekly Japanese candlesticks reversal pattern Hammer which started when the price reversed up from the key support level 0.6700 earlier this week.
The upward reversal from the support level 0.6700 stopped the previous extended downward impulse sequence (3) from the end of 2019.
Given the strength of the aforementioned support level 0.6700, oversold reading on the weekly RSI indicator (rare buy signal) – CADCHF is likely to rise further toward the next round resistance level 0.7000.