Categories: Technical analysis

CADCHF Wave Analysis – 2 January, 2023

• CADCHF reversed from support level 0.6790

• Likely to rise to resistance level 0.6850

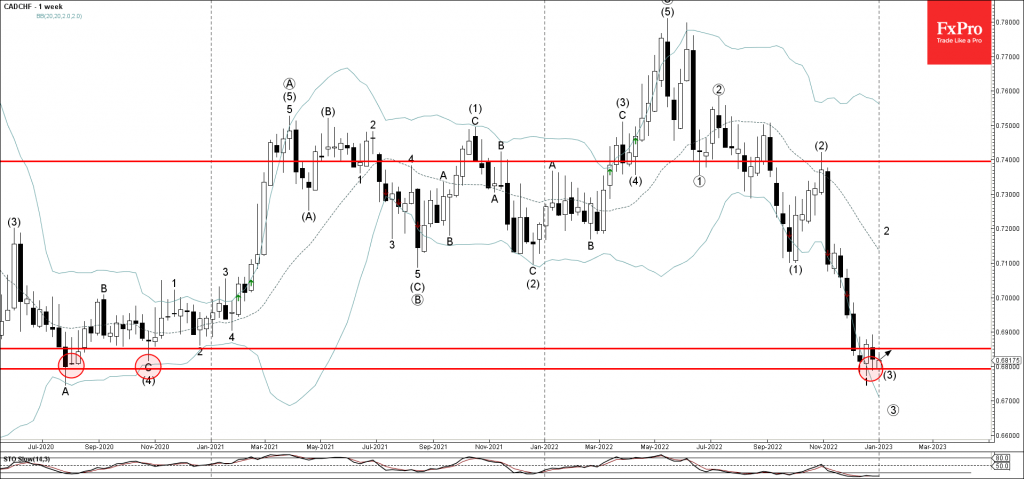
CADCHF recently reversed up from the key long-term support level 0.6790 (which has been reversing the price from the middle of 2020, as can be seen from the weekly CADCHF chart below).

The support area near the support level 0.6790 was strengthened by the lower weekly Bollinger band.

Given the oversold reading on the weekly Stochastic indicator, CADCHF can be expected to rise further toward the next resistance level 0.6850.

The FxPro Tech Analysis Team

The FxPro technical experts prepare a daily analysis of the most active currency pairs (majors, crosses, exotics) and commodities. Selected instruments are reviewed on daily trends (D1, H4), using the active Elliott Wave setups, Japanese candlesticks, indicators, and support/resistance levels.

Share
Published by
The FxPro Tech Analysis Team
Tags: CADCHF

Recent Posts

The yen returned to the Takaichi trade

The dollar resumed its growth after the lawsuit against the Fed chairman. Rumours of early…

1 hour ago

Nat Gas Current situation #tradelikeapro #trading #natgas #tradingstrategy #tradingshorts

Today is Tuesday, the 13th of January, and we will talk about the natural gas…

3 hours ago

Bitcoin Cash Wave Analysis – 12 January 2026

Bitcoin Cash: ⬇️ Sell - Bitcoin Cash reversed from resistance area - Likely to fall…

12 hours ago

EURJPY Wave Analysis – 12 January 2026

EURJPY: ⬆️ Buy - EURJPY reversed from support area - Likely to rise to resistance…

12 hours ago

Gold shines on an anti-fiat thesis

The dollar suffered due to threats to the Fed’s independence. Gold managed to renew its…

22 hours ago

SP500 Current situation #trading #tradelikeapro #sp500 #tradingshorts #tradingstrategy

Today is Monday, the 12th of January, and once again we will talk about the…

23 hours ago

This website uses cookies