Categories: Technical analysis

CADCHF Wave Analysis – 18 November 2025

CADCHF: ⬆️ Buy

– CADCHF reversed from key support level 0.5600

– Likely to rise to resistance level 0.5750

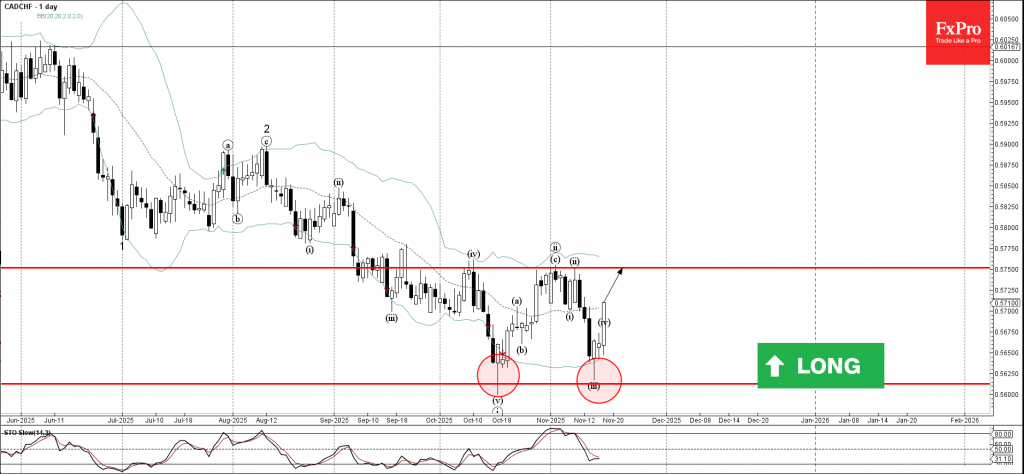
CADCHF currency pair recently reversed from key support level 0.5600 (which stopped the previous impulse wave i in the middle of October, as can be seen from the daily CADCHF chart below) standing near the lower daily Bollinger band.

The upward reversal from the support level 0.5600 created the daily Japanese candlesticks reversal pattern Hammer.

Given the strength of the support level 0.5600 and the strongly bearish Swiss franc sentiment seen today, CADCHF can be expected to rise to the next resistance level 0.5750.

The FxPro Tech Analysis Team

The FxPro technical experts prepare a daily analysis of the most active currency pairs (majors, crosses, exotics) and commodities. Selected instruments are reviewed on daily trends (D1, H4), using the active Elliott Wave setups, Japanese candlesticks, indicators, and support/resistance levels.

Share
Published by
The FxPro Tech Analysis Team
Tags: CADCHF

Recent Posts

EURAUD Wave Analysis – 6 January 2026 Wave Analysis – 6 January 2026

EURAUD: ⬇️ Sell - EURAUD broke strong support level 1.7465 - Likely to fall to…

3 hours ago

IBM Wave Analysis – 6 January 2026

IBM: ⬆️ Buy - IBM reversed from support zone - Likely to rise to resistance…

3 hours ago

Palladium Wave Analysis – 6 January 2026

Palladium: ⬆️ Buy - Palladium reversed from round support level 1600.00 - Likely to rise…

3 hours ago

Amazon Wave Analysis – 6 January 2026

Amazon: ⬆️ Buy - Amazon broke resistance zone - Likely to rise to resistance level…

3 hours ago

Pro News Flash: Gold Bulls Take Control

🥇 Gold is regaining momentum as investors lean into geopolitics, a softer US dollar and…

9 hours ago

The dollar is forced to retreat

• The reduction in geopolitical risks in Venezuela has weakened the greenback. •  Precious metal investors…

13 hours ago

This website uses cookies