Categories: Technical analysis

CADCHF Wave Analysis – 17 March 2023

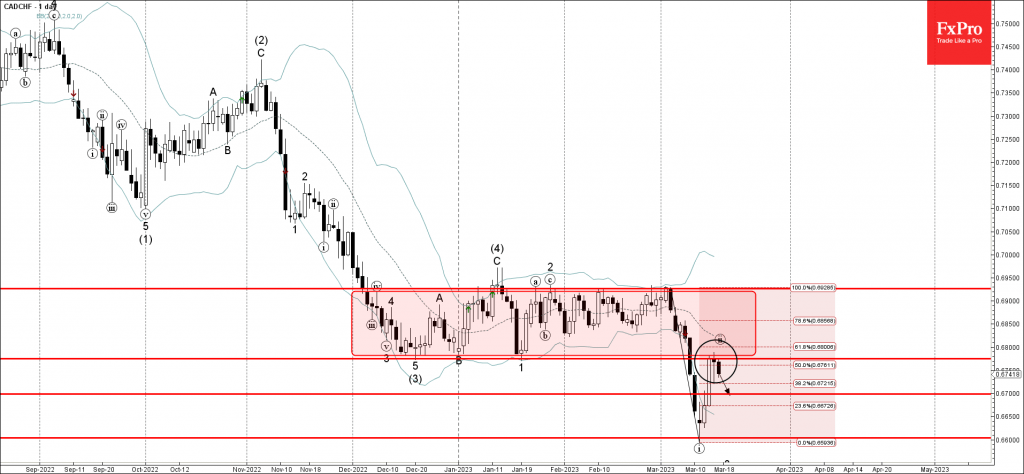
• CADCHF reversed from key resistance level 0.6775

• Likely to fall to support level 0.6700

CADCHF recently reversed down from the key resistance level 0.6775 (former lower boundary of the sideways price range from December, acting as the resistance after it was broken earlier this month).

The resistance level 0.6775 was further strengthened by the 50% Fibonacci correction of the downward impulse from the start of March.

Given the clear daily downtrend, CADCHF can then be expected to fall further toward the next key support level 0.6700.

The FxPro Tech Analysis Team

The FxPro technical experts prepare a daily analysis of the most active currency pairs (majors, crosses, exotics) and commodities. Selected instruments are reviewed on daily trends (D1, H4), using the active Elliott Wave setups, Japanese candlesticks, indicators, and support/resistance levels.

Share
Published by
The FxPro Tech Analysis Team
Tags: CADCHF

Recent Posts

German industrial production slide brings closer ECB’s rate cut  

German industrial production continues to decline. The rate of contraction in March was slightly better…

6 hours ago

US indices are heading towards highs

US indices have been gaining daily since the beginning of May. They have found strength…

8 hours ago

Persisting pressure on crypto

Market picture  The crypto market has lost 2% of its capitalisation over the last 24…

11 hours ago

S&P 500 Wave Analysis 7 May 2024

- S&P 500 reversed from support level 5000.00 - Likely to rise to resistance level…

1 day ago

USDCHF Wave Analysis 7 May 2024

- USDCHF reversed from support zone - Likely to rise to resistance level 0.9200 USDCHF…

1 day ago

EURUSD at the equilibrium, where will it go next?

The single currency is trading near $1.076, waiting for further cues and facing serious resistance…

1 day ago

This website uses cookies