Categories: Technical analysis

CADCHF Wave Analysis 02 November, 2020

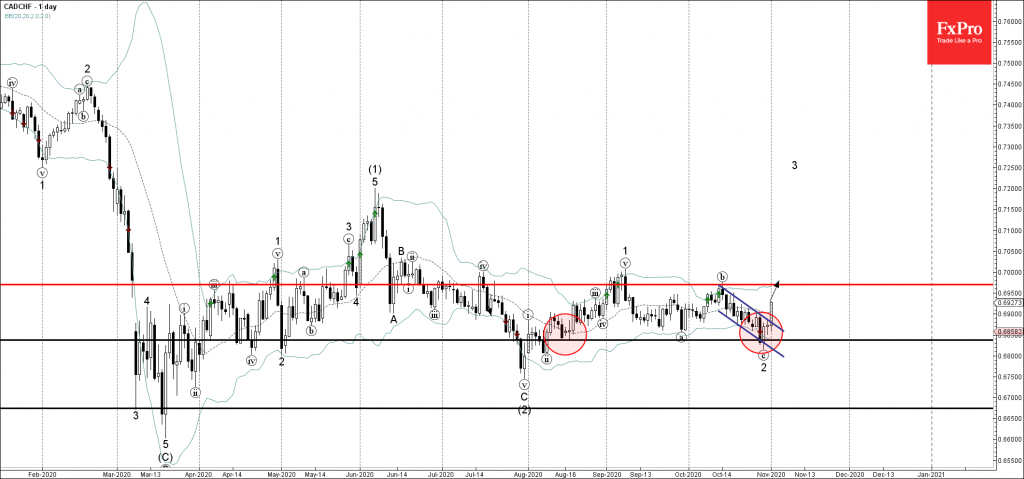
• CADCHF reversed from support zone

• Likely to rise to 0.6970

CADCHF continues to rise inside the short-term impulse wave 3, which started earlier from the support zone lying between the support level 0.6840, lower daily Bollinger Band and the support trendline of the daily down channel from October.

The active impulse wave 3 belongs to the strong intermediate upward impulse sequence (3) from the end of July.

CADCHF is likely to rise further toward the next strong resistance level 0.6970 (top of wave (b) of the previous ABC correction 2).

The FxPro Tech Analysis Team

The FxPro technical experts prepare a daily analysis of the most active currency pairs (majors, crosses, exotics) and commodities. Selected instruments are reviewed on daily trends (D1, H4), using the active Elliott Wave setups, Japanese candlesticks, indicators, and support/resistance levels.

Share
Published by
The FxPro Tech Analysis Team
Tags: CADCHF

Recent Posts

USDJPY Wave Analysis 26 April 2024

- USDJPY broke key resistance level 155.00 - Likely to rise to resistance level 160.00…

2 days ago

Ebay Wave Analysis 26 April 2024

- Ebay reversed from support level 49.35 - Likely to rise to resistance level 52.55…

2 days ago

False Alert with Yen Interventions?

Even though the Bank of Japan left the key rate and parameters of the QE…

2 days ago

Cooler Bitcoin

Market picture  Market Dynamics: The cryptocurrency market stabilised, losing just 0.1% of capitalisation and dropping to…

2 days ago

GBPCAD Wave Analysis 25 April 2024

- GBPCAD reversed from key support level 1.6910 - Likely to rise to resistance level…

3 days ago

GBPAUD Wave Analysis 25 April 2024

- GBPAUD reversed from support level 1.9135 - Likely to rise to resistance level 1.9360…

3 days ago

This website uses cookies