Categories: Technical analysis

Brent Crude Oil Wave Analysis – 4 October, 2019

  • Brent Crude Oil reversed from support level 56.00
  • Likely to rise to 60.00

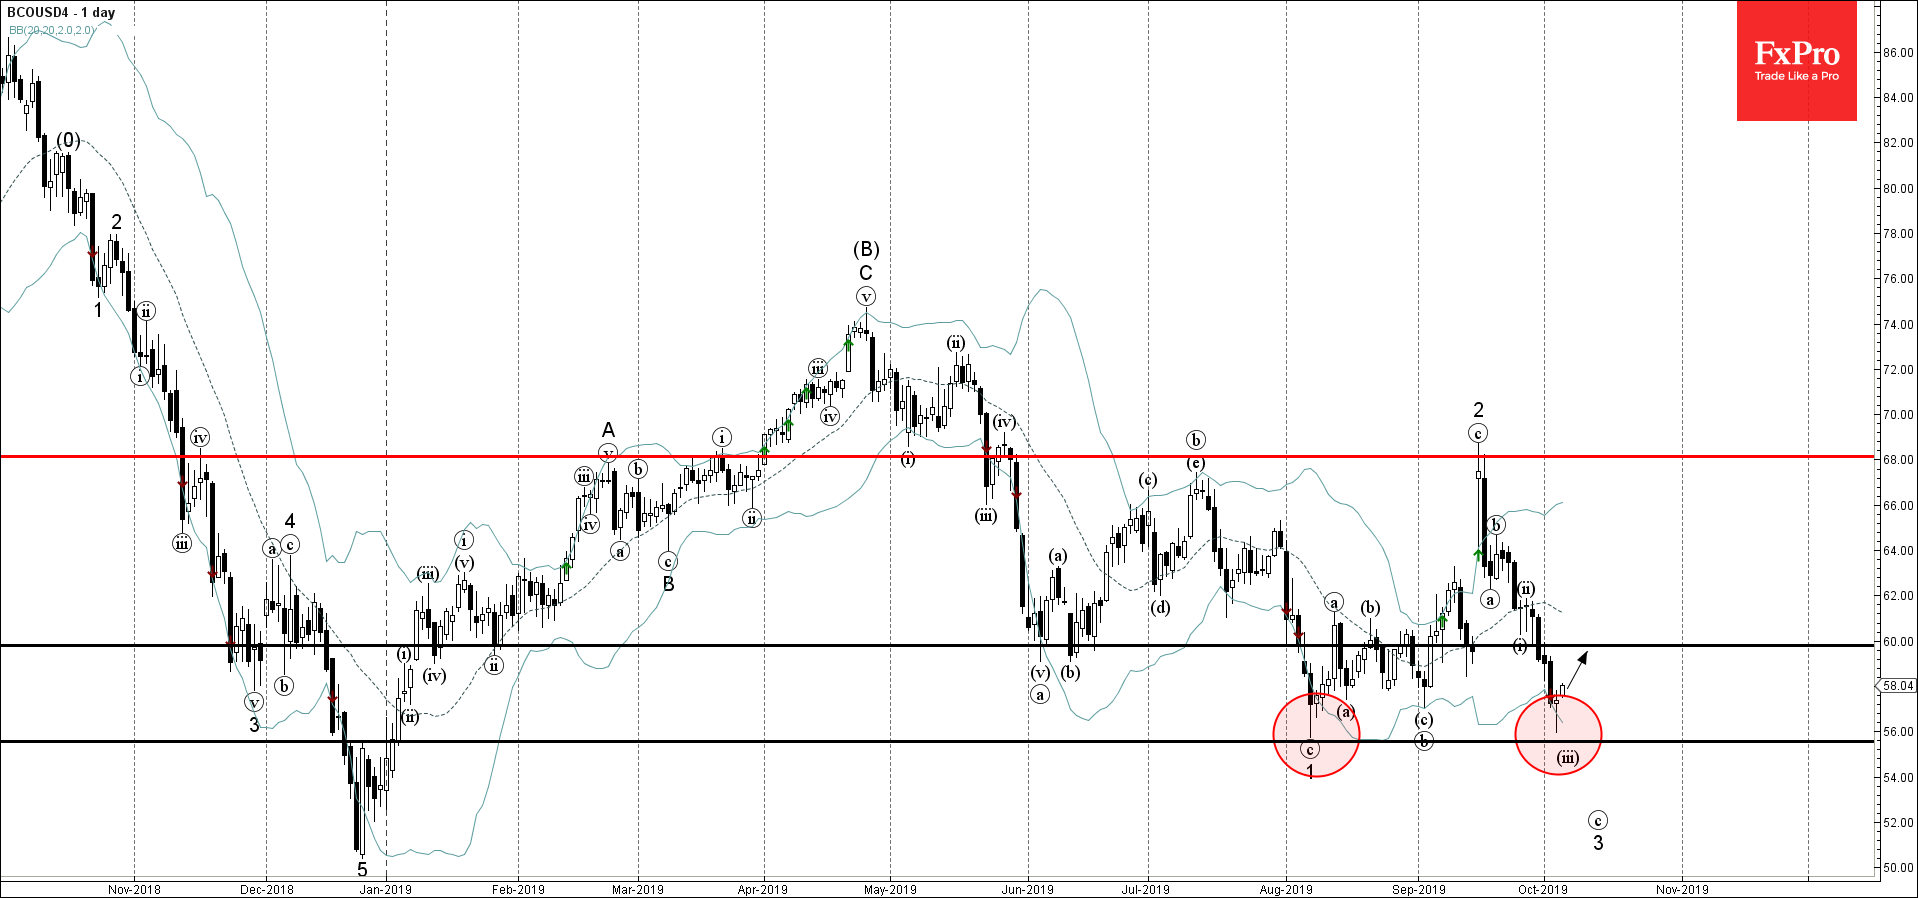
Brent Crude Oil recently reversed up from the support area located between the key support level 56,00 (which stopped the previous impulse wave 1 in August) and the lower daily Bollinger Band.

The upward reversal from this support area created the daily Japanese candlesticks reversal pattern Hammer Doj – standing outside of the lower daily Bollinger Band.

Brent Crude Oil is expected to rise further and retest the next resistance level 60.00 (former support  from September).

AddThis Website Tools
The FxPro Tech Analysis Team

The FxPro technical experts prepare a daily analysis of the most active currency pairs (majors, crosses, exotics) and commodities. Selected instruments are reviewed on daily trends (D1, H4), using the active Elliott Wave setups, Japanese candlesticks, indicators, and support/resistance levels.

Share
Published by
The FxPro Tech Analysis Team
Tags: BCOUSD

Recent Posts

Gold Wave Analysis – 19 March 2025

Gold: ⬆️ Buy - Gold continues daily uptrend - Likely to rise to resistance level…

3 hours ago

EURJPY Wave Analysis – 19 March 2025

EURJPY: ⬇️ Sell - EURJPY reversed from resistance zone - Likely to fall to support…

3 hours ago

NZDUSD Wave Analysis – 19 March 2025

NZDUSD: ⬇️ Sell - NZDUSD reversed from the resistance level 0.5820 - Likely to fall…

11 hours ago

EURUSD Wave Analysis – 19 March 2025

EURUSD: ⬇️ Sell - EURUSD reversed from resistance level 1.0930 - Likely to fall to…

11 hours ago

Ethereum gives way

The crypto market remains in a downtrend, with Ethereum losing market share while Bitcoin's share…

16 hours ago

GBPUSD Wave Analysis – 18 March 2025

GBPUSD: ⬆️ Buy - GBPUSD reversed from support zone - Likely to rise to resistance…

1 day ago