Categories: Technical analysis

Brent Crude Oil Wave Analysis – 20 December , 2018

  • Brent Crude Oil broke support area
  • Further losses are likely

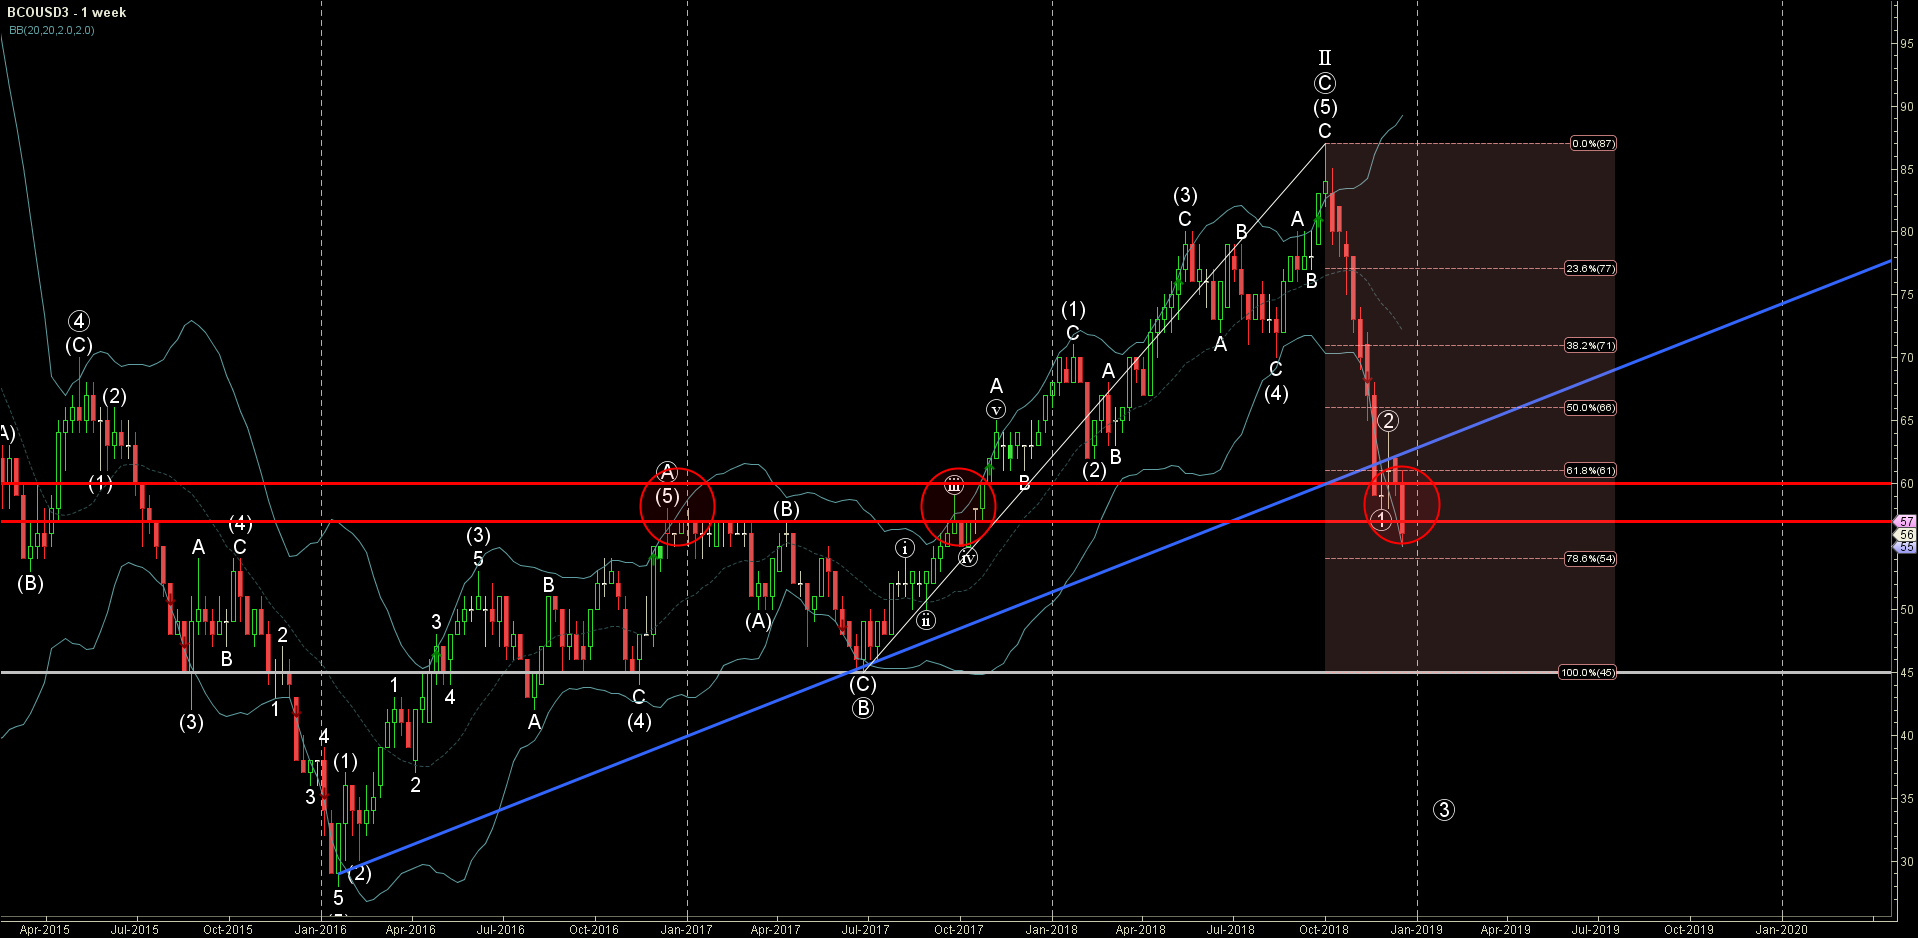
Brent Crude Oil recently broke through the support area lying between the support levels 60.00 and 57.00, 61.8% Fibonacci correction of the previous weekly upward impulse from the middle of 2017 and the weekly support trendline from the start of 2016.

The breakout of this support area accelerated the active downward impulse wave ③ which belongs to the sharp downward impulse sequence III from September.

Brent Crude Oil is expected to fall further and re-test the next support levels 55.00 and 50.00.

The FxPro Tech Analysis Team

The FxPro technical experts prepare a daily analysis of the most active currency pairs (majors, crosses, exotics) and commodities. Selected instruments are reviewed on daily trends (D1, H4), using the active Elliott Wave setups, Japanese candlesticks, indicators, and support/resistance levels.

Share
Published by
The FxPro Tech Analysis Team
Tags: BCOUSD

Recent Posts

Bitcoin’s Downtrend, Solana and Ethereum Form Double Bottom

Market picture  Crypto market capitalisation rose 3.3% in 24 hours to $2.22 trillion. Local capitalisation…

3 hours ago

EURJPY Wave Analysis 2 May 2024

- EURJPY under strong bearish pressure - Likely to fall to support level 163.10 EURJPY…

17 hours ago

WTI crude oil Wave Analysis 2 May 2024

- WTI broke round support level 80.00 - Likely to fall to support level 76.00…

17 hours ago

ADP hints at another strong NFP on Friday

The monthly ADP labour market report showed that America created 192K new jobs in April, above…

2 days ago

Fed’s hawkish tone risks sinking S&P500 to 4700

Bears showed strength ahead of the FOMC decision.  U.S. indices sagged on Tuesday as investors…

2 days ago

A new stage of Bitcoin’s decline

Market Picture  Bitcoin's closing price on Tuesday became the lowest since late February, confirming the…

2 days ago

This website uses cookies