Categories: Technical analysis

Boeing Wave Analysis 30 September, 2020

• Boeing broke daily down channel

• Likely to rise to 180.00

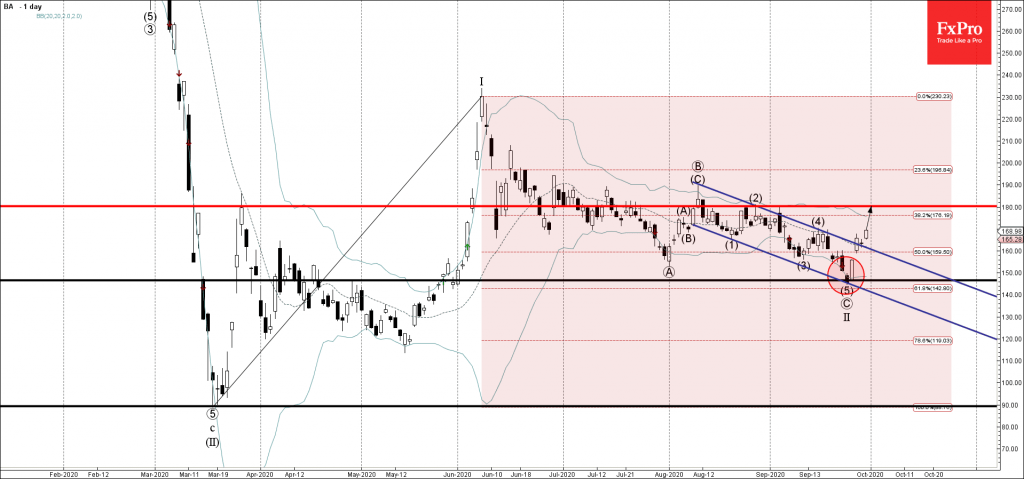
Boeing recently broke the resistance trendline of the daily down channel from August – which enclosed the previous downward impulse sequence Ⓒ.

The breakout of this down channel should accelerate the active upward impulse sequence (1) – which started earlier from the round support level 150.00, intersecting with the aforementioned down channel.

Boeing is likely to rise further toward the next resistance level 180.00 (top of the previous wave (2) from the end of August).

The FxPro Tech Analysis Team

The FxPro technical experts prepare a daily analysis of the most active currency pairs (majors, crosses, exotics) and commodities. Selected instruments are reviewed on daily trends (D1, H4), using the active Elliott Wave setups, Japanese candlesticks, indicators, and support/resistance levels.

Share
Published by
The FxPro Tech Analysis Team
Tags: BA

Recent Posts

A slightly weaker CPI was not enough to break through the highs

US CPI data a bit softer than forecasts, sparking brief market optimism, but resistance remains.…

21 minutes ago

Crude Oil counteracts

Middle East tensions and Venezuelan supply shifts drive Brent crude volatility, with geopolitical risks and…

4 hours ago

Crypto market grows with risk appetite in stocks

Crypto market edges up as risk appetite returns; Bitcoin and Ethereum recover, despite investor caution…

5 hours ago

The yen returned to the Takaichi trade

The dollar resumed its growth after the lawsuit against the Fed chairman. Rumours of early…

6 hours ago

Nat Gas Current situation #tradelikeapro #trading #natgas #tradingstrategy #tradingshorts

Today is Tuesday, the 13th of January, and we will talk about the natural gas…

8 hours ago

Bitcoin Cash Wave Analysis – 12 January 2026

Bitcoin Cash: ⬇️ Sell - Bitcoin Cash reversed from resistance area - Likely to fall…

17 hours ago

This website uses cookies