Categories: Technical analysis

Boeing Wave Analysis 24 March, 2021

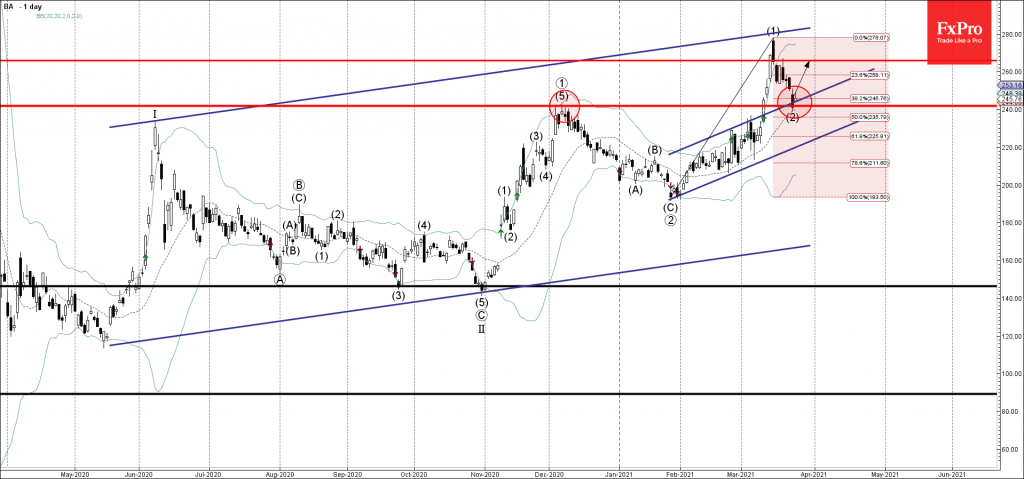
• Boeing reversed from support zone

• Likely to reach resistance level 266.00

Boeing recently reversed up from the support zone lying between the powerful support level 242.00 (former multi-month resistance from December), upper trendline of the daily up channel from January and the 38.2% Fibonacci correction of the upward impulse (1).

The upward reversal from this support zone stopped the previous medium-term ABC corrective wave (2).

Given the prevailing uptrend – Boeing is likely to rise further in the active impulse wave (3) toward the next resistance level 266.00.

The FxPro Tech Analysis Team

The FxPro technical experts prepare a daily analysis of the most active currency pairs (majors, crosses, exotics) and commodities. Selected instruments are reviewed on daily trends (D1, H4), using the active Elliott Wave setups, Japanese candlesticks, indicators, and support/resistance levels.

Share
Published by
The FxPro Tech Analysis Team
Tags: Boeing

Recent Posts

Bitcoin Wave Analysis – 14 January 2026

Bitcoin: ⬆️ Buy - Bitcoin broke resistance area - Likely to rise to resistance level…

1 hour ago

NZDJPY Wave Analysis – 14 January 2026

NZDJPY: ⬇️ Sell - NZDJPY reversed down from the resistance area - Likely to fall…

1 hour ago

The dollar does not tolerate dissent

US GDP growth is driven not by the White House, but by AI. The Bank…

11 hours ago

The crypto market has made a breakthrough

The crypto market surges, hitting new highs, with bullish sentiment for Bitcoin and Ethereum amid…

12 hours ago

Brent Crude oil Wave Analysis – 13 January 2026

Brent Crude oil ⬆️ Buy - Brent Crude oil rising inside impulse wave c -…

1 day ago

USDJPY Wave Analysis – 13 January 2026

USDJPY ⬆️ Buy - USDJPY broke resistance area - Likely to rise to resistance level…

1 day ago

This website uses cookies