Categories: Technical analysis

Boeing Wave Analysis – 14 April 2023

• Boeing falling inside impulse waves 3 and (3)

• Likely to reach support level 193.10

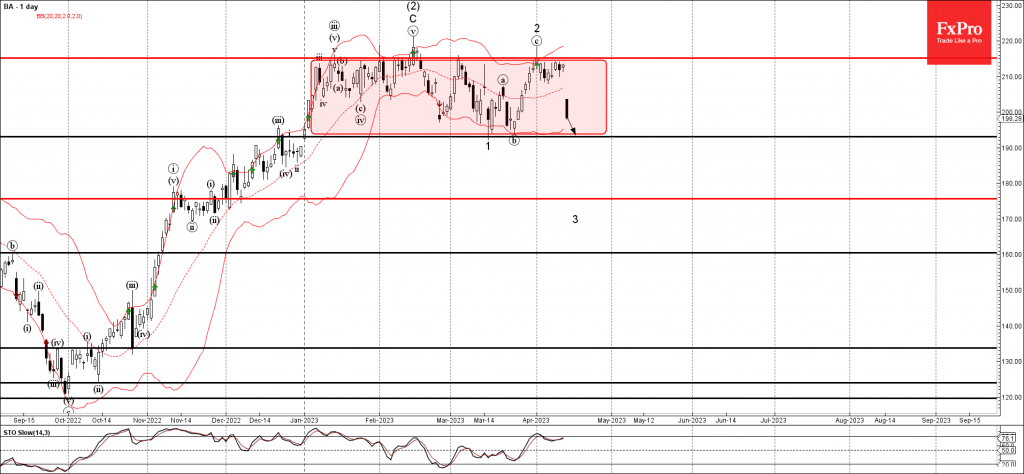
Boeing continues to fall inside the minor impulse wave 3, which belongs to the intermediate impulse wave (3) from February.

Both of the active impulse waves 3 and (3) started from the resistance level 215.00, which is the upper boundary of the sideways price range inside which the price has been trading from January.

Boeing can then be expected to fall further toward the next support level 193.10 (low boundary of the active sideways price range).

The FxPro Tech Analysis Team

The FxPro technical experts prepare a daily analysis of the most active currency pairs (majors, crosses, exotics) and commodities. Selected instruments are reviewed on daily trends (D1, H4), using the active Elliott Wave setups, Japanese candlesticks, indicators, and support/resistance levels.

Share
Published by
The FxPro Tech Analysis Team
Tags: Boeing

Recent Posts

Adobe Wave Analysis 3 May 2024

- Adobe reversed from support zone - Likely to rise to resistance level 500.00 Adobe…

4 hours ago

EURGBP Wave Analysis 3 May 2024

- EURJPY reversed from support zone - Likely to rise to resistance level 0.8625 EURGBP…

4 hours ago

How Low Can the USDJPY Go?

USDJPY was slipping below 153 on Friday morning, a three-week low and having lost over…

10 hours ago

Bitcoin’s Downtrend, Solana and Ethereum Form Double Bottom

Market picture  Crypto market capitalisation rose 3.3% in 24 hours to $2.22 trillion. Local capitalisation…

16 hours ago

EURJPY Wave Analysis 2 May 2024

- EURJPY under strong bearish pressure - Likely to fall to support level 163.10 EURJPY…

1 day ago

WTI crude oil Wave Analysis 2 May 2024

- WTI broke round support level 80.00 - Likely to fall to support level 76.00…

1 day ago

This website uses cookies