Categories: Technical analysis

BNB Wave Analysis – 29 September 2025

BNB: ⬆️ Buy

– BNB reversed from support area

– Likely to rise to resistance level 117325.00

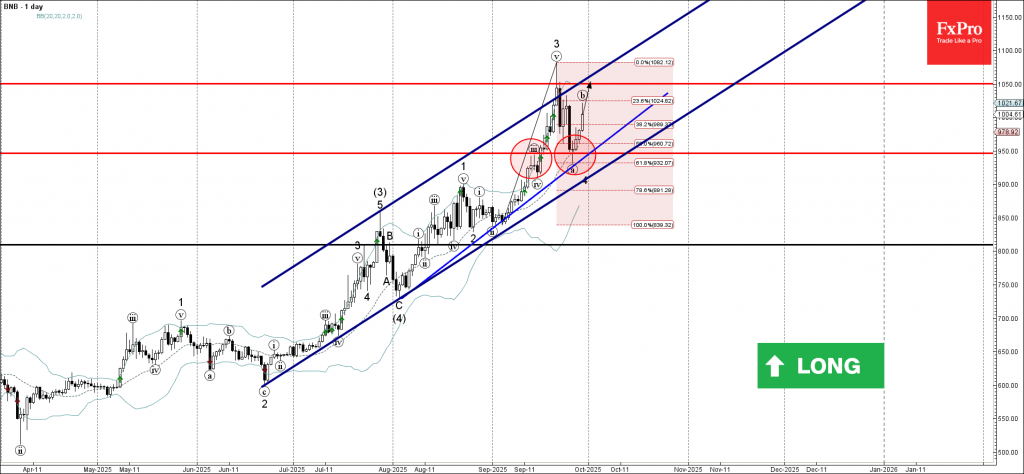
BNB recently reversed from the support area between the support level 950.00 (former resistance from the middle of September), 20-day moving average, support trendline from August and the 61.8% Fibonacci correction of the upward impulse from the start of September.

The upward reversal from this support area created the daily Japanese candlesticks reversal pattern Doji, which started the active short-term corrective wave (b).

Given the strong daily uptrend, BNB can be expected to rise to the next resistance level 1050.00 (which stopped earlier impulse wave 3).

The FxPro Tech Analysis Team

The FxPro technical experts prepare a daily analysis of the most active currency pairs (majors, crosses, exotics) and commodities. Selected instruments are reviewed on daily trends (D1, H4), using the active Elliott Wave setups, Japanese candlesticks, indicators, and support/resistance levels.

Share
Published by
The FxPro Tech Analysis Team
Tags: BNB

Recent Posts

CADJPY Wave Analysis – 26 December 2025

CADJPY: ⬆️ Buy - CADJPY broke resistance level 114.30 - Likely to rise to resistance…

1 day ago

Toncoin Wave Analysis – 26 December 2025

Toncoin: ⬆️ Buy - Toncoin reversed from support zone - Likely to rise to resistance…

1 day ago

Nvidia Wave Analysis – 26 December 2025

Nvidia: ⬆️ Buy - Nvidia reversed from support zone - Likely to rise to resistance…

1 day ago

Palladium Wave Analysis – 26 December 2025

Palladium: ⬆️ Buy - Palladium reversed from support zone - Likely to rise to resistance…

1 day ago

AUDUSD Wave Analysis – 24 December 2025

AUDUSD: ⬆️ Buy - AUDUSD broke key resistance level 0.6690 - Likely to rise to…

3 days ago

Tron Wave Analysis – 24 December 2025

Tron: ⬇️ Sell - Tron reversed from resistance zone - Likely to fall to support…

3 days ago

This website uses cookies