Categories: Technical analysis

BMY Wave Analysis 21 January, 2021

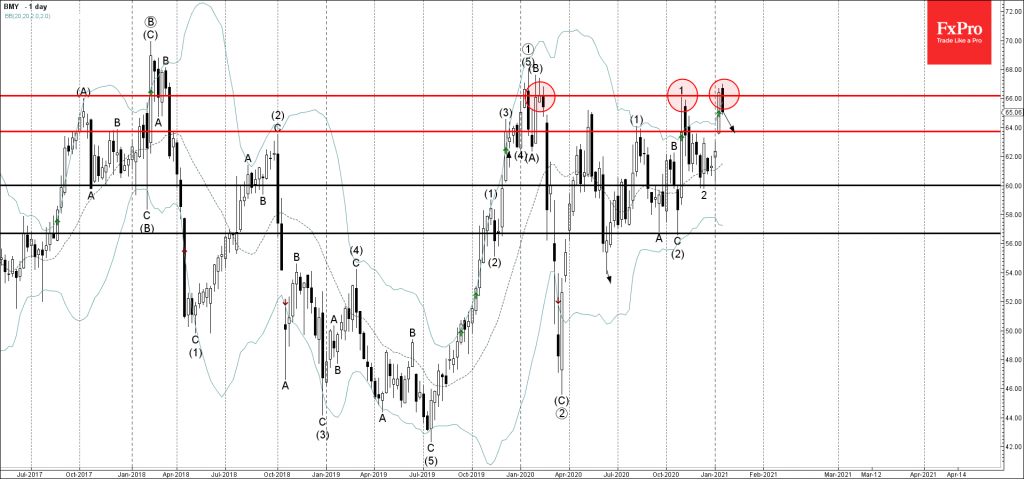
• BMY reversed from major resistance level 66.10

• Likely to test support level 64.00

BMY recently reversed down from the major resistance level 66.10 (monthly high from October) – standing well above the upper daily Bollinger Band.

The same resistance level 66.10 reversed the price sharply at the beginning of January – which started the previous sharp downward impulse wave (C).

BMY is expected to fall further toward the next support level 64.00 (former monthly high from July).

The FxPro Tech Analysis Team

The FxPro technical experts prepare a daily analysis of the most active currency pairs (majors, crosses, exotics) and commodities. Selected instruments are reviewed on daily trends (D1, H4), using the active Elliott Wave setups, Japanese candlesticks, indicators, and support/resistance levels.

Share
Published by
The FxPro Tech Analysis Team
Tags: BMY

Recent Posts

USDJPY Wave Analysis 26 April 2024

- USDJPY broke key resistance level 155.00 - Likely to rise to resistance level 160.00…

16 hours ago

Ebay Wave Analysis 26 April 2024

- Ebay reversed from support level 49.35 - Likely to rise to resistance level 52.55…

16 hours ago

False Alert with Yen Interventions?

Even though the Bank of Japan left the key rate and parameters of the QE…

1 day ago

Cooler Bitcoin

Market picture  Market Dynamics: The cryptocurrency market stabilised, losing just 0.1% of capitalisation and dropping to…

1 day ago

GBPCAD Wave Analysis 25 April 2024

- GBPCAD reversed from key support level 1.6910 - Likely to rise to resistance level…

2 days ago

GBPAUD Wave Analysis 25 April 2024

- GBPAUD reversed from support level 1.9135 - Likely to rise to resistance level 1.9360…

2 days ago

This website uses cookies