Categories: Technical analysis

Bitcoin Wave Analysis – 5 March 2025

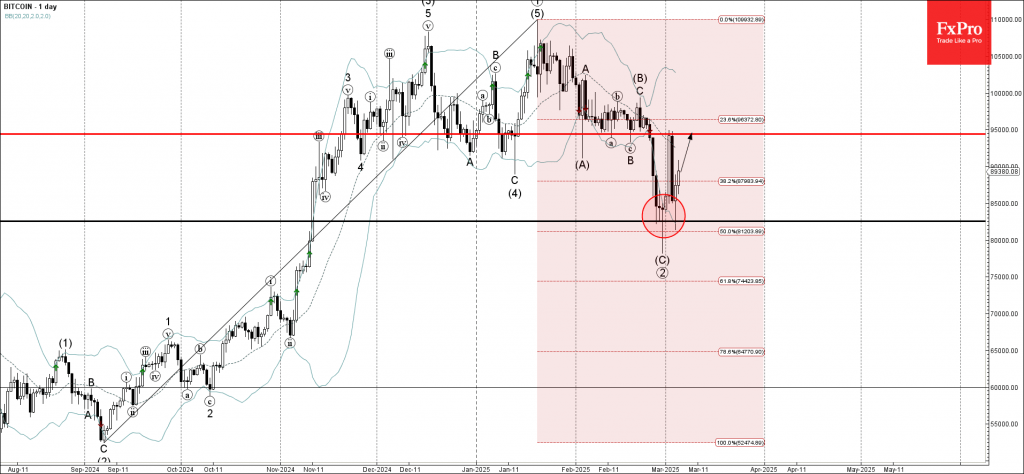
– Bitcoin reversed from support zone

– Likely to rise to resistance level 95000.00

Bitcoin recently reversed up multiple times from the support zone located between the key support level 82550.00 standing near the lower daily Bollinger Band and the 50% Fibonacci correction of the upward impulse from September.

The upward reversal from this support zone created the daily Japanese candlesticks reversal pattern Hammer Doji.

Bitcoin can be expected to rise toward the next resistance level 95000.00, which reversed the price sharply earlier this month.

AddThis Website Tools
The FxPro Tech Analysis Team

The FxPro technical experts prepare a daily analysis of the most active currency pairs (majors, crosses, exotics) and commodities. Selected instruments are reviewed on daily trends (D1, H4), using the active Elliott Wave setups, Japanese candlesticks, indicators, and support/resistance levels.

Share
Published by
The FxPro Tech Analysis Team
Tags: Bitcoin

Recent Posts

Bitcoin Wave Analysis – 22 April 2025

Bitcoin: ⬆️ Buy - Bitcoin broke round resistance level 90000.00 - Likely to rise to…

14 hours ago

AUDUSD Wave Analysis – 22 April 2025

AUDUSD: ⬇️ Sell - AUDUSD reversed from the key resistance level 0.6400 - Likely to…

14 hours ago

Crypto Market Escapes from Fear

Market Overview The crypto market has gained around 2% over the past seven days, with…

1 day ago

Nike Wave Analysis – 21 April 2025

Nike: ⬆️ Buy - Nike reversed from the long-term support level 52.60 - Likely to…

2 days ago

Natural Gas Wave Analysis – 21 April 2025

Natural gas: ⬇️ Sell Natural gas broke support area Likely to fall to support level…

2 days ago

EURUSD Wave Analysis – 21 April 2025

EURUSD: ⬆️ Buy - EURUSD broke the resistance area - Likely to test resistance level…

2 days ago