Technical analysis

Bitcoin Wave Analysis – 14 January 2026

Bitcoin: ⬆️ Buy

– Bitcoin broke resistance area

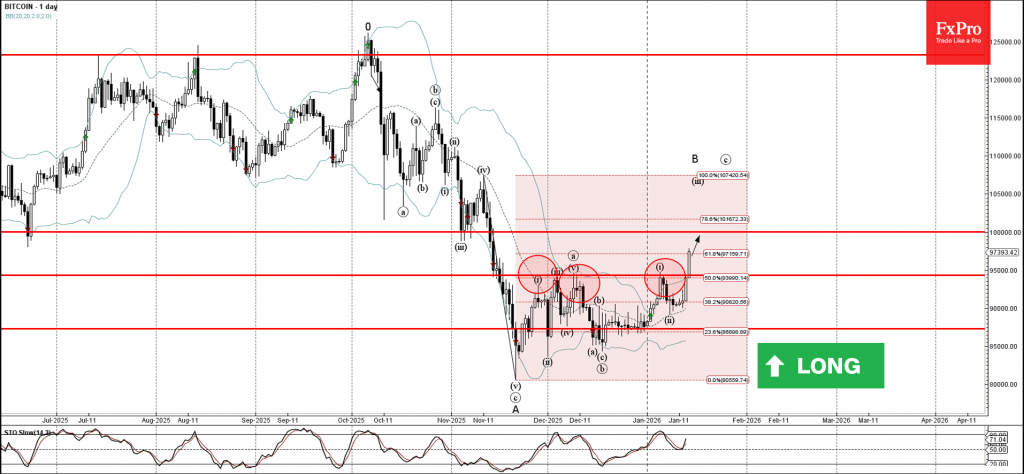
– Likely to rise to resistance level 100000.00

Bitcoin cryptocurrency recently broke the resistance area between the pivotal resistance level 95000.00 (which has been reversing the price from November) and the 50% Fibonacci correction of the downward impulse from November.

The breakout of this resistance area accelerated the active impulse wave iii – which belongs to the medium-term impulse wave B from November.

Bitcoin cryptocurrency can be expected to rise to the next major resistance level 100000.00 (former support from June and November).

The FxPro Tech Analysis Team

The FxPro technical experts prepare a daily analysis of the most active currency pairs (majors, crosses, exotics) and commodities. Selected instruments are reviewed on daily trends (D1, H4), using the active Elliott Wave setups, Japanese candlesticks, indicators, and support/resistance levels.

Share
Published by
The FxPro Tech Analysis Team
Tags: Bitcoin

Recent Posts

NZDJPY Wave Analysis – 14 January 2026

NZDJPY: ⬇️ Sell - NZDJPY reversed down from the resistance area - Likely to fall…

2 hours ago

What is Leverage?

Leverage is a mechanism that lets traders control larger positions using smaller capital. By choosing…

6 hours ago

The dollar does not tolerate dissent

US GDP growth is driven not by the White House, but by AI. The Bank…

12 hours ago

The crypto market has made a breakthrough

The crypto market surges, hitting new highs, with bullish sentiment for Bitcoin and Ethereum amid…

12 hours ago

Brent Crude oil Wave Analysis – 13 January 2026

Brent Crude oil ⬆️ Buy - Brent Crude oil rising inside impulse wave c -…

1 day ago

USDJPY Wave Analysis – 13 January 2026

USDJPY ⬆️ Buy - USDJPY broke resistance area - Likely to rise to resistance level…

1 day ago

This website uses cookies