Categories: Technical analysis

Bitcoin Cash Wave Analysis – 3 December 2025

Bitcoin Cash: ⬆️ Buy

– Bitcoin Cash broke resistance zone

– Likely to rise to resistance level 630.00

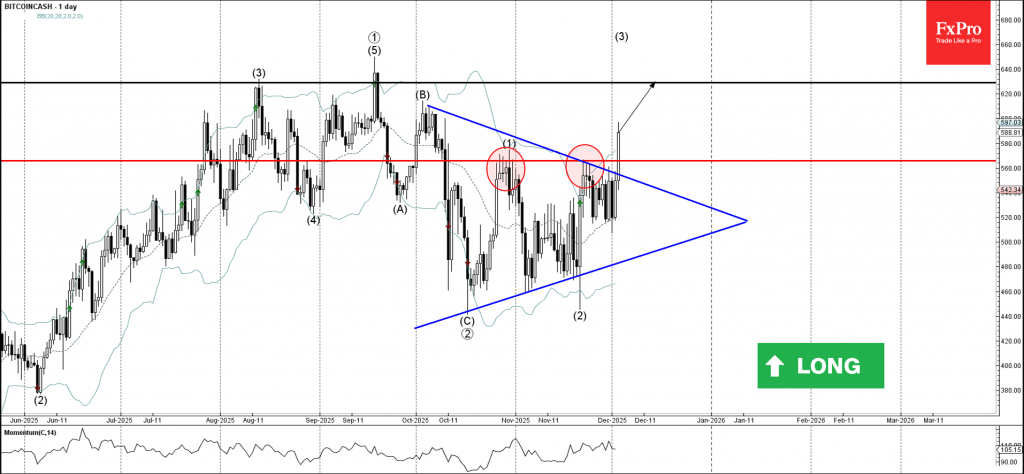
Bitcoin Cash cryptocurrency recently broke the resistance zone between the resistance level 565.00 and the resistance trendline of the daily Triangle from October.

The breakout of this resistance zone accelerated the active medium-term impulse wave (3) from the middle of November.

Given the improved sentiment across crypto markets today, Bitcoin Cash can be expected to rise to the next round resistance level 630.00 (which stopped previous waves (3) and (5)).

The FxPro Tech Analysis Team

The FxPro technical experts prepare a daily analysis of the most active currency pairs (majors, crosses, exotics) and commodities. Selected instruments are reviewed on daily trends (D1, H4), using the active Elliott Wave setups, Japanese candlesticks, indicators, and support/resistance levels.

Share
Published by
The FxPro Tech Analysis Team
Tags: Bitcoin Cash

Recent Posts

Pro News Weekly: Dollar Leads as Stocks Wobble

Welcome to Pro News Weekly! Here’s what is driving the markets this week: 💵 The…

19 hours ago

Strong macro data and rate spreads are the USD’s main weapon

Strong US macro data and wide rate spreads boost the dollar, pressuring EURUSD and gold;…

1 day ago

Top 10 Forex Trading Strategies

We have outlined the 10 best forex trading strategies with clear logic, real-world context, and…

1 day ago

Bitcoin has not crossed the correction line

Bitcoin holds near $95.5K as the market steadies but hasn't confirmed a exit from correction…

1 day ago

CHFJPY Wave Analysis – 15 January 2026

CHFJPY: ⬇️ Sell - CHFJPY reversed from resistance zone - Likely to fall to support level…

2 days ago

WTI Crude Oil Wave Analysis – 15 January 2026

WTI Crude Oil: ⬇️ Sell - WTI Crude Oil rising inside minor impulse wave (1) -…

2 days ago

This website uses cookies