Categories: Technical analysis

Bit-comment: BTC calmed while ETH gain its momentum

The Bitcoin price has remained virtually unchanged over the past 24 hours, remaining close to $10,200. As for the tech analysis, the first cryptocurrency remains trapped in the triangle, showing a weakening of the oscillation amplitude since late June. Among the key points, it is worth noting that BTCUSD trades below the 50-day average, which acts as a relatively reliable signal line. Staying under it is often accompanied by the dominance of bears, which are connected to the sales on the attempts of growth.

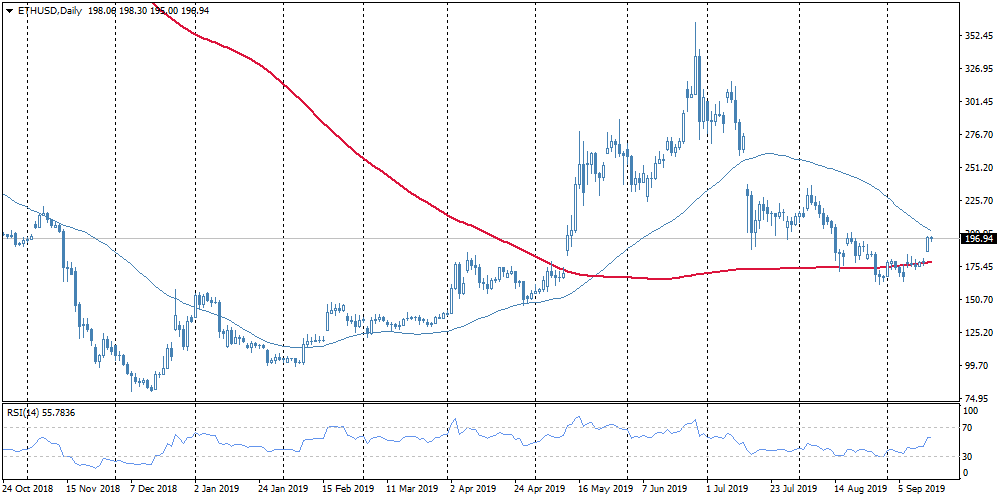
Meanwhile, Ethereum is characterized by positive dynamics, adding 2.5% per day and around 20% to the lows of 10 days ago. Apparently, the first altcoin found support near the 200-day average and turned upward, approaching the round $200 level. In the stock market, a 20% increase from the lows is considered as the beginning of the bull market phase, which may well be a good signal for ETH.

The FxPro Analyst Team
The FxPro Analyst Team

Our team consists of financial market experts. Our dedicated professionals prepare reviews on the foreign exchange market situation, Crude Oil, Gold and Stock Indices. All the analysts are regularly published in the world leading economic media.

Share
Published by
The FxPro Analyst Team

Recent Posts

GBPUSD Wave Analysis 14 November 2024

- GBPUSD reversed from strong support level 1.2665 - Likely to rise to resistance level…

7 hours ago

USDCAD Wave Analysis 14 November 2024

- USDCAD broke resistance level 1.3950 - Likely to rise to resistance level 1.4050 USDCAD…

7 hours ago

The dollar has reached range limits

The US dollar has strengthened, reaching the upper boundary of its trading range. The British…

10 hours ago

Crypto: Tug-of-war at new altitude

Cryptocurrencies continued to surge, pushing the total cap to $3 trillion. Bitcoin has gained nearly…

10 hours ago

USDJPY Wave Analysis 13 November 2024

- USDJPY broke key resistance level 154.70 - Likely to rise to resistance level 157.20…

1 day ago

USDJPY Wave Analysis 13 November 2024

- USDJPY broke key resistance level 154.70 - Likely to rise to resistance level 157.20…

1 day ago

This website uses cookies