Technical analysis

Binance Coin Wave Analysis – 31 December 2025

Binance Coin: ⬆️ Buy

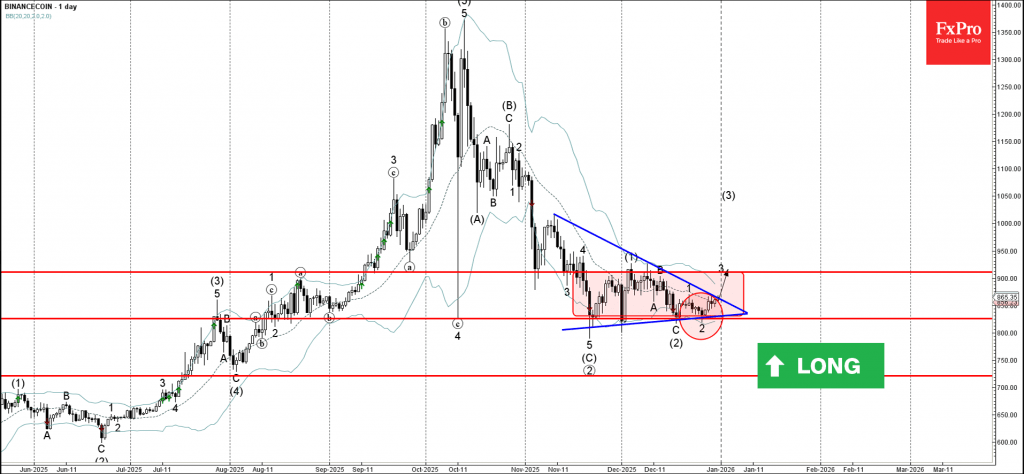
– Binance Coin broke Descending Triangle

– Likely to rise to resistance level 911.00

Binance Coin cryptocurrency recently reversed from the support area between the support level 825.55 (lower border of the sideways price range from November) and the lower daily Bollinger Band.

The upward reversal from the support level 825.55 started the active impulse wave 3 – which then broke the daily Descending Triangle from November.

Binance Coin cryptocurrency be expected to rise to the next resistance level 911.00 (upper border of the active sideways price range and the target for the completion of the active impulse wave 3).

The FxPro Tech Analysis Team

The FxPro technical experts prepare a daily analysis of the most active currency pairs (majors, crosses, exotics) and commodities. Selected instruments are reviewed on daily trends (D1, H4), using the active Elliott Wave setups, Japanese candlesticks, indicators, and support/resistance levels.

Share
Published by
The FxPro Tech Analysis Team
Tags: Binance

Recent Posts

EURJPY Wave Analysis – 31 December 2025

EURJPY: ⬆️ Buy - EURJPY reversed from support area - Likely to rise to resistance…

3 hours ago

Uniswap Wave Analysis – 31 December 2025

Uniswap: ⬇️ Sell - Uniswap reversed from resistance area - Likely to fall to support…

3 hours ago

S&P 500 Wave Analysis – 31 December 2025

S&P 500: ⬇️ Sell - S&P 500 reversed from strong resistance level 6935.00 - Likely…

3 hours ago

The dollar may defy expectations

•  The return of American exceptionalism will help the greenback. •  The yen will start…

8 hours ago

Stellar Wave Analysis – 30 December 2025

Stellar: ⬇️ Sell - Stellar reversed from resistance area - Likely to fall to support…

19 hours ago

Silver Wave Analysis – 30 December 2025

Silver: ⬆️ Buy - Silver reversed from support area - Likely to rise to resistance…

19 hours ago

This website uses cookies