Categories: Technical analysis

Bank of America Wave Analysis 12 November, 2020

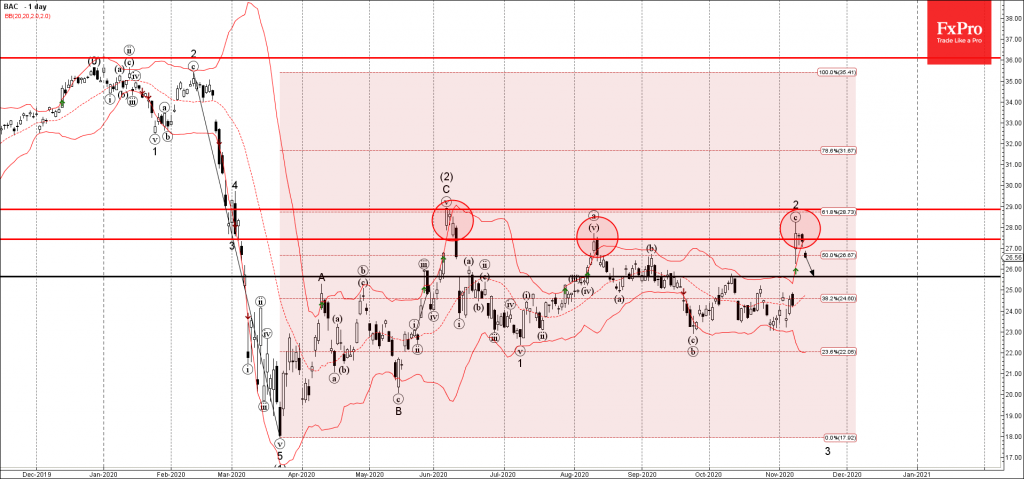
• Bank of America reversed from resistance zone

• Likely to fall to 25.65

Bank of America earlier reversed down from the resistance zone located between the resistance level 27,50 (monthly high from August), upper daily Bollinger Band and the 61,8% Fibonacci correction of the downward impulse from February.

The downward reversal from this resistance zone started the active short-term impulse wave 3.

Bank of America is likely to fall further toward the next support level 25.65 (former monthly high from October).

AddThis Website Tools
The FxPro Tech Analysis Team

The FxPro technical experts prepare a daily analysis of the most active currency pairs (majors, crosses, exotics) and commodities. Selected instruments are reviewed on daily trends (D1, H4), using the active Elliott Wave setups, Japanese candlesticks, indicators, and support/resistance levels.

Share
Published by
The FxPro Tech Analysis Team
Tags: BAC

Recent Posts

Video: Dollar and Indices are trying to find footing after the fall

The dollar experienced a sell-off but rallied back up by the end of the week.…

7 hours ago

What is next: BoJ, Fed, SNB & BoE Rates

The new week will be packed with economic data and decisions from key central banks.…

10 hours ago

Dollar attempts to rebound after oversold conditions

Despite economic factors working against the dollar, its oversold condition helped it this week or…

11 hours ago

USDCAD Wave Analysis – 14 March 2025

USDCAD: ⬇️ Sell - USDCAD reversed from key resistance level 1.4500 - Likely to fall…

12 hours ago

Solana Wave Analysis – 14 March 2025

Solana: ⬆️ Buy - Solana reversed from the long-term support level 113.75 - Likely to…

12 hours ago

Adobe Wave Analysis – 13 March 2025

Adobe: ⬇️ Sell - Adobe broke round support level 400.00 - Likely to fall to…

1 day ago