Categories: Technical analysis

Baidu Wave Analysis 9 February, 2021

• Baidu rising sharply

• Likely to reach resistance level 320.00

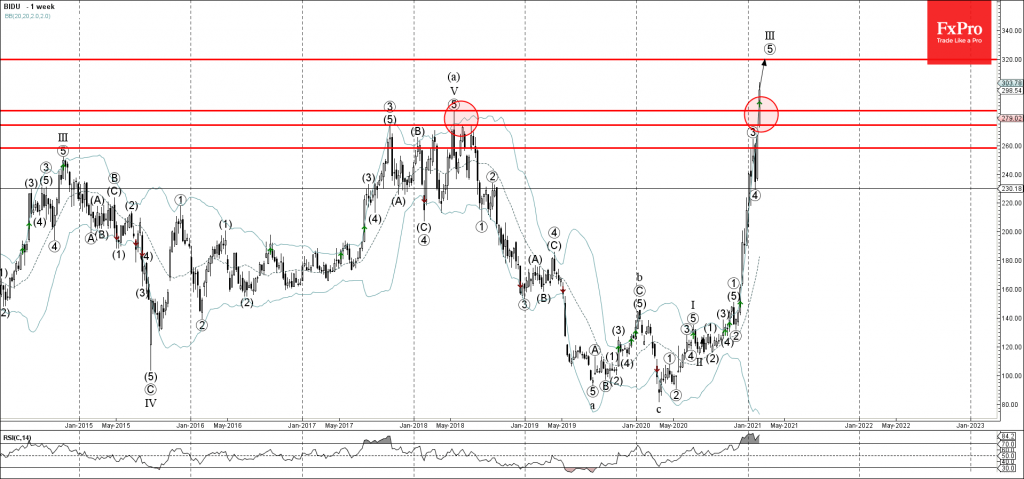
Baidu continues to rise sharply after the price broke above the major long-term resistance level 284.00 (former multi-year high from 2018).

The breakout of the resistance level 284.00 is aligned with the very strong daily and weekly uptrends of this instrument – as can be seen below.

Baidu is likely to rise further toward the next resistance level 320.00 (forecast price for the completion of the weekly impulse sequence III from last year)

The FxPro Tech Analysis Team

The FxPro technical experts prepare a daily analysis of the most active currency pairs (majors, crosses, exotics) and commodities. Selected instruments are reviewed on daily trends (D1, H4), using the active Elliott Wave setups, Japanese candlesticks, indicators, and support/resistance levels.

Share
Published by
The FxPro Tech Analysis Team
Tags: BIDU

Recent Posts

Brent Crude oil Wave Analysis – 13 January 2026

Brent Crude oil ⬆️ Buy - Brent Crude oil rising inside impulse wave c -…

45 minutes ago

USDJPY Wave Analysis – 13 January 2026

USDJPY ⬆️ Buy - USDJPY broke resistance area - Likely to rise to resistance level…

45 minutes ago

Exxon Mobil Wave Analysis – 13 January 2026

Exxon Mobil ⬆️ Buy - Exxon Mobil broke resistance level 125.60 - Likely to rise…

46 minutes ago

BNB Wave Analysis – 13 January 2026

Brent Crude oil ⬆️ Buy - BNB broke out of sideways price range - Likely…

47 minutes ago

A slightly weaker CPI was not enough to break through the highs

US CPI data a bit softer than forecasts, sparking brief market optimism, but resistance remains.…

6 hours ago

Pro News Flash: Global Tensions Fuel a Fresh Oil Rally

🛢️ Oil prices are finding fresh strength as geopolitical tensions in the Middle East reignite…

7 hours ago

This website uses cookies