Categories: Technical analysis

Baidu Wave Analysis – 22 May, 2020

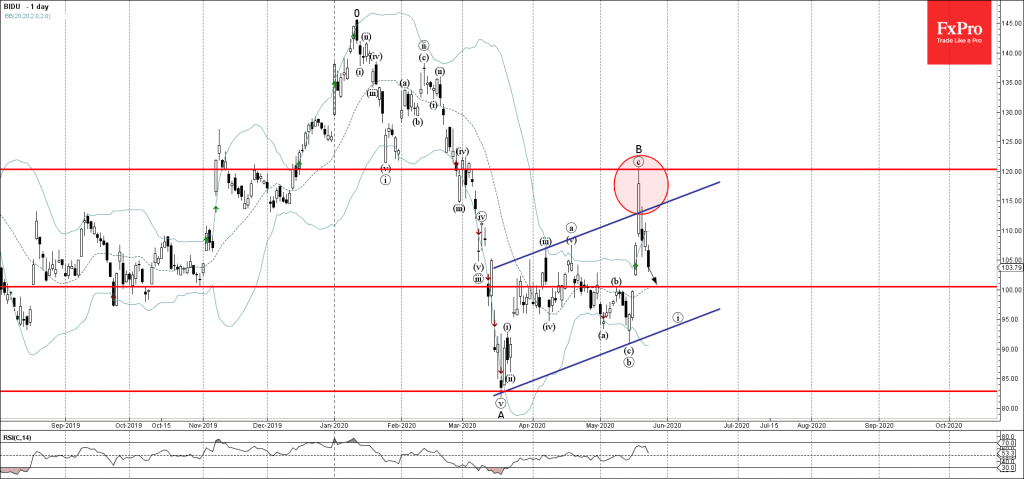
• Baidu reversed from key resistance level 120.00

• Likely to fall to 100.00

Baidu recently reversed down sharply from the key resistance level 120.00 – standing well outside of the upper daily Bollinger Band.

The downward reversal from the resistance level 120.00 started the active short-term impulse wave  

Baidu is likely to fall further toward the next round support level 100.00 (former resistance form the start of May – which stopped the previous correction (b)).

AddThis Website Tools
The FxPro Tech Analysis Team

The FxPro technical experts prepare a daily analysis of the most active currency pairs (majors, crosses, exotics) and commodities. Selected instruments are reviewed on daily trends (D1, H4), using the active Elliott Wave setups, Japanese candlesticks, indicators, and support/resistance levels.

Share
Published by
The FxPro Tech Analysis Team
Tags: BIDU

Recent Posts

S&P 500 Wave Analysis – 1 April 2025

S&P 500: ⬆️ Buy - S&P 500 reversed from support area - Likely to rise…

2 hours ago

GBPAUD Wave Analysis – 1 April 2025

GBPAUD: ⬇️ Sell - GBPAUD reversed from long-term resistance level 2.0820 - Likely to fall…

2 hours ago

Crypto’s Attempt to Stabilise

The cryptocurrency market has experienced some volatility, with a 1.1% rise in 24 hours and…

14 hours ago

NIO Wave Analysis – 31 March 2025

NIO: ⬆️ Buy - NIO reversed from support zone - Likely to rise to resistance…

1 day ago

Nvidia Wave Analysis – 31 March 2025

Nvidia: ⬆️ Buy - Nvidia reversed from key support level 105.00 - Likely to rise…

1 day ago

Markets rattled on consumer sentiment

Consumer sentiment index from the University of Michigan shows alarming information for stock indices, with…

1 day ago