Categories: Technical analysis

Baidu Wave Analysis – 04 August, 2020

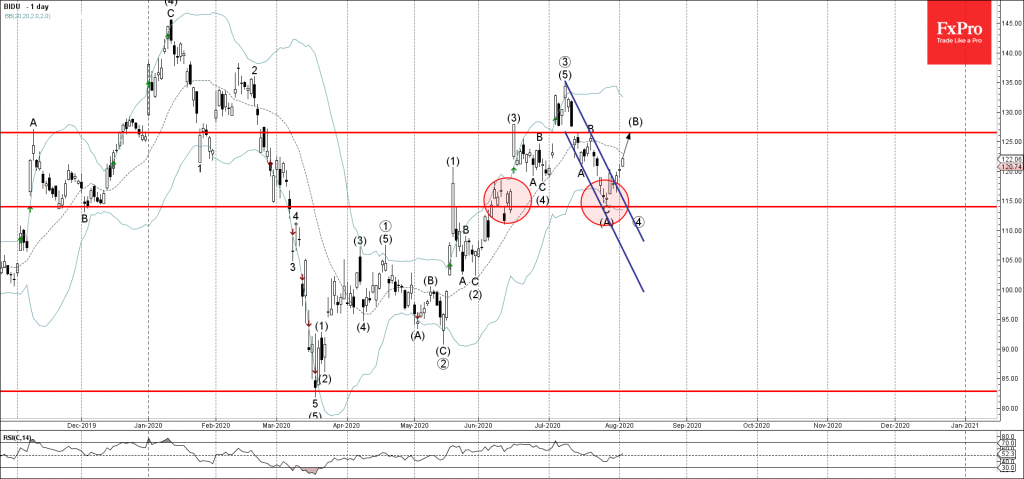
• Baidu rising inside wave (B)

• Likely to rise to 126.50

Baidu continues to rise inside the corrective wave (B) – which started earlier from the support level 114.00 (which also reversed the price in the middle of June), standing near the lower daily Bollinger Bad.

The price earlier broke the daily down channel from the start of June (which enclosed the previous wave (A)) – which accelerated the active wave (B).

Baidu is likely to rise further toward the next resistance level 126.50 (top of the minor correction B from June and the projected price for the completion of the active correction (B)).

The FxPro Tech Analysis Team

The FxPro technical experts prepare a daily analysis of the most active currency pairs (majors, crosses, exotics) and commodities. Selected instruments are reviewed on daily trends (D1, H4), using the active Elliott Wave setups, Japanese candlesticks, indicators, and support/resistance levels.

Share
Published by
The FxPro Tech Analysis Team
Tags: BIDU

Recent Posts

Brent Crude oil Wave Analysis – 13 January 2026

Brent Crude oil ⬆️ Buy - Brent Crude oil rising inside impulse wave c -…

2 hours ago

USDJPY Wave Analysis – 13 January 2026

USDJPY ⬆️ Buy - USDJPY broke resistance area - Likely to rise to resistance level…

2 hours ago

Exxon Mobil Wave Analysis – 13 January 2026

Exxon Mobil ⬆️ Buy - Exxon Mobil broke resistance level 125.60 - Likely to rise…

2 hours ago

BNB Wave Analysis – 13 January 2026

Brent Crude oil ⬆️ Buy - BNB broke out of sideways price range - Likely…

2 hours ago

A slightly weaker CPI was not enough to break through the highs

US CPI data a bit softer than forecasts, sparking brief market optimism, but resistance remains.…

8 hours ago

Pro News Flash: Global Tensions Fuel a Fresh Oil Rally

🛢️ Oil prices are finding fresh strength as geopolitical tensions in the Middle East reignite…

8 hours ago

This website uses cookies